Coca Cola 2006 Annual Report Download - page 82
Download and view the complete annual report
Please find page 82 of the 2006 Coca Cola annual report below. You can navigate through the pages in the report by either clicking on the pages listed below, or by using the keyword search tool below to find specific information within the annual report.-
 1
1 -
2
-
3
-
4
-
5
-
6
-
7
-
8
-
9
-
10
-
11
-
12
-
13
-
14
-
15
-
16
-
17
-
18
-
19
-
20
-
21
-
22
-
23
-
24
-
25
-
26
-
27
-
28
-
29
-
30
-
31
-
32
-
33
-
34
-
35
-
36
-
37
-
38
-
39
-
40
-
41
-
42
-
43
-
44
-
45
-
46
-
47
-
48
-
49
-
50
-
51
-
52
-
53
-
54
-
55
-
56
-
57
-
58
-
59
-
60
-
61
-
62
-
63
-
64
-
65
-
66
-
67
-
68
-
69
-
70
-
71
-
 72
72 -
 73
73 -
 74
74 -
 75
75 -
 76
76 -
 77
77 -
 78
78 -
 79
79 -
 80
80 -
 81
81 -
 82
82 -
 83
83 -
 84
84 -
 85
85 -
 86
86 -
 87
87 -
 88
88 -
 89
89 -
 90
90 -
 91
91 -
 92
92 -
93
-
94
-
95
-
96
-
97
-
98
-
99
-
100
-
101
-
102
-
103
-
104
-
105
-
106
-
107
-
108
-
109
-
110
-
111
-
112
-
113
-
114
-
115
-
116
-
117
-
118
-
119
-
120
-
121
-
122
-
123
-
124
-
125
-
126
-
127
-
128
-
129
-
130
-
131
-
132
-
133
-
134
-
135
-
136
-
137
-
138
-
139
-
140
-
141
-
142
-
143
-
144
 |
 |

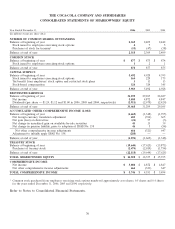
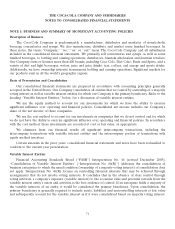
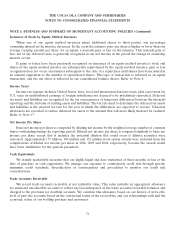
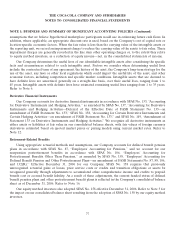
THE COCA-COLA COMPANY AND SUBSIDIARIES
NOTES TO CONSOLIDATED FINANCIAL STATEMENTS
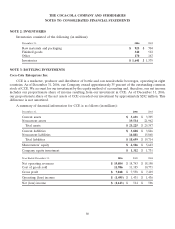
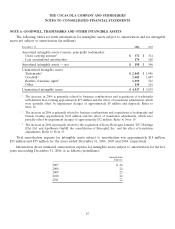
NOTE 2: INVENTORIES
Inventories consisted of the following (in millions):
December 31, 2006 2005
Raw materials and packaging $ 923 $ 704
Finished goods 548 512
Other 170 163
Inventories $ 1,641 $ 1,379
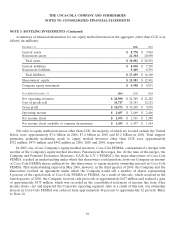
NOTE 3: BOTTLING INVESTMENTS
Coca-Cola Enterprises Inc.
CCE is a marketer, producer and distributor of bottle and can nonalcoholic beverages, operating in eight
countries. As of December 31, 2006, our Company owned approximately 35 percent of the outstanding common
stock of CCE. We account for our investment by the equity method of accounting and, therefore, our net income
includes our proportionate share of income resulting from our investment in CCE. As of December 31, 2006,
our proportionate share of the net assets of CCE exceeded our investment by approximately $282 million. This
difference is not amortized.
A summary of financial information for CCE is as follows (in millions):
December 31, 2006 2005
Current assets $ 3,691 $ 3,395
Noncurrent assets 19,534 21,962
Total assets $ 23,225 $ 25,357
Current liabilities $ 3,818 $ 3,846
Noncurrent liabilities 14,881 15,868
Total liabilities $ 18,699 $ 19,714
Shareowners’ equity $ 4,526 $ 5,643
Company equity investment $ 1,312 $ 1,731
Year Ended December 31, 2006 2005 2004
Net operating revenues $ 19,804 $ 18,743 $ 18,190
Cost of goods sold 11,986 11,185 10,771
Gross profit $ 7,818 $ 7,558 $ 7,419
Operating (loss) income $ (1,495) $ 1,431 $ 1,436
Net (loss) income $ (1,143) $ 514 $ 596
80