Coca Cola 2006 Annual Report Download - page 40
Download and view the complete annual report
Please find page 40 of the 2006 Coca Cola annual report below. You can navigate through the pages in the report by either clicking on the pages listed below, or by using the keyword search tool below to find specific information within the annual report.-
 1
1 -
2
-
3
-
4
-
5
-
6
-
7
-
8
-
9
-
10
-
11
-
12
-
13
-
14
-
15
-
16
-
17
-
18
-
19
-
20
-
21
-
22
-
23
-
24
-
25
-
26
-
27
-
28
-
29
-
 30
30 -
 31
31 -
 32
32 -
 33
33 -
 34
34 -
 35
35 -
 36
36 -
 37
37 -
 38
38 -
 39
39 -
 40
40 -
 41
41 -
 42
42 -
 43
43 -
 44
44 -
 45
45 -
 46
46 -
 47
47 -
 48
48 -
 49
49 -
 50
50 -
51
-
52
-
53
-
54
-
55
-
56
-
57
-
58
-
59
-
60
-
61
-
62
-
63
-
64
-
65
-
66
-
67
-
68
-
69
-
70
-
71
-
72
-
73
-
74
-
75
-
76
-
77
-
78
-
79
-
80
-
81
-
82
-
83
-
84
-
85
-
86
-
87
-
88
-
89
-
90
-
91
-
92
-
93
-
94
-
95
-
96
-
97
-
98
-
99
-
100
-
101
-
102
-
103
-
104
-
105
-
106
-
107
-
108
-
109
-
110
-
111
-
112
-
113
-
114
-
115
-
116
-
117
-
118
-
119
-
120
-
121
-
122
-
123
-
124
-
125
-
126
-
127
-
128
-
129
-
130
-
131
-
132
-
133
-
134
-
135
-
136
-
137
-
138
-
139
-
140
-
141
-
142
-
143
-
144
 |
 |

Equity Method and Cost Method Investments
We review our equity and cost method investments in every reporting period to determine whether a
significant event or change in circumstances has occurred that may have an adverse effect on the fair value of
each investment. When such events or changes occur, we evaluate the fair value compared to the carrying value
of the related investment. We also perform this evaluation every reporting period for each investment for which
the carrying value has exceeded the fair value in the prior period. The fair values of most of our Company’s
investments in publicly traded companies are often readily available based on quoted market prices. For
investments in nonpublicly traded companies, management’s assessment of fair value is based on valuation
methodologies including discounted cash flows, estimates of sales proceeds and external appraisals, as
appropriate. We consider the assumptions that we believe hypothetical marketplace participants would use in
evaluating estimated future cash flows when employing the discounted cash flow or estimate of sales proceeds
valuation methodologies. The ability to accurately predict future cash flows, especially in developing and
unstable markets, may impact the determination of fair value.
In the event a decline in fair value of an investment occurs, management may be required to determine if
the decline in fair value is other than temporary. Management’s assessment as to the nature of a decline in fair
value is based on the valuation methodologies discussed above, our ability and intent to hold the investment, and
whether evidence indicating the cost of the investment is recoverable within a reasonable period of time
outweighs evidence to the contrary. We consider most of our equity method investees to be strategic long-term
investments. If the fair value of an investment is less than its carrying value and the decline in value is considered
to be other than temporary, a write-down is recorded. Management’s assessments of fair value represent our
best estimates as of the time of the impairment review and are consistent with the assumptions that we believe
hypothetical marketplace participants would use. If different assessments were made, this could have a material
impact on our consolidated financial statements.
The following table presents the difference between calculated fair values, based on quoted closing prices of
publicly traded shares, and our Company’s carrying values for significant investments in publicly traded bottlers
accounted for as equity method investees (in millions):
Fair Carrying
December 31, 2006 Value Value Difference
Coca-Cola Enterprises Inc. $ 3,450 $ 1,3121$ 2,138
Coca-Cola Hellenic Bottling Company S.A. 2,247 1,251 996
Coca-Cola FEMSA, S.A.B. de C.V. 2,172 835 1,337
Coca-Cola Amatil Limited 1,456 817 639
Coca-Cola Icecek A.S. 372 110 262
Grupo Continental, S.A. 327 165 162
Coca-Cola Embonor S.A. 228 189 39
Coca-Cola Bottling Company Consolidated 170 68 102
Embotelladoras Polar S.A. 93 59 34
$ 10,515 $ 4,806 $ 5,709
1In 2006, our carrying value of CCE was reduced by our proportionate share of an impairment charge
recorded by CCE. Refer to Note 3 of Notes to Consolidated Financial Statements.
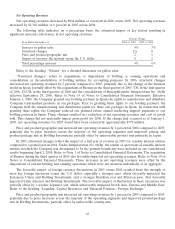
Other Assets
Our Company invests in infrastructure programs with our bottlers that are directed at strengthening our
bottling system and increasing unit case volume. Additionally, our Company advances payments to certain
customers to fund future marketing activities intended to generate profitable volume and expenses such
payments over the periods benefited. Advance payments are also made to certain customers for distribution
rights. Payments under these programs are generally capitalized and reported as other assets in our consolidated
38