Coca Cola 2006 Annual Report Download - page 32
Download and view the complete annual report
Please find page 32 of the 2006 Coca Cola annual report below. You can navigate through the pages in the report by either clicking on the pages listed below, or by using the keyword search tool below to find specific information within the annual report.-
 1
1 -
2
-
3
-
4
-
5
-
6
-
7
-
8
-
9
-
10
-
11
-
12
-
13
-
14
-
15
-
16
-
17
-
18
-
19
-
20
-
21
-
 22
22 -
 23
23 -
 24
24 -
 25
25 -
 26
26 -
 27
27 -
 28
28 -
 29
29 -
 30
30 -
 31
31 -
 32
32 -
 33
33 -
 34
34 -
 35
35 -
 36
36 -
 37
37 -
 38
38 -
 39
39 -
 40
40 -
 41
41 -
 42
42 -
43
-
44
-
45
-
46
-
47
-
48
-
49
-
50
-
51
-
52
-
53
-
54
-
55
-
56
-
57
-
58
-
59
-
60
-
61
-
62
-
63
-
64
-
65
-
66
-
67
-
68
-
69
-
70
-
71
-
72
-
73
-
74
-
75
-
76
-
77
-
78
-
79
-
80
-
81
-
82
-
83
-
84
-
85
-
86
-
87
-
88
-
89
-
90
-
91
-
92
-
93
-
94
-
95
-
96
-
97
-
98
-
99
-
100
-
101
-
102
-
103
-
104
-
105
-
106
-
107
-
108
-
109
-
110
-
111
-
112
-
113
-
114
-
115
-
116
-
117
-
118
-
119
-
120
-
121
-
122
-
123
-
124
-
125
-
126
-
127
-
128
-
129
-
130
-
131
-
132
-
133
-
134
-
135
-
136
-
137
-
138
-
139
-
140
-
141
-
142
-
143
-
144
 |
 |
20FEB200719225952
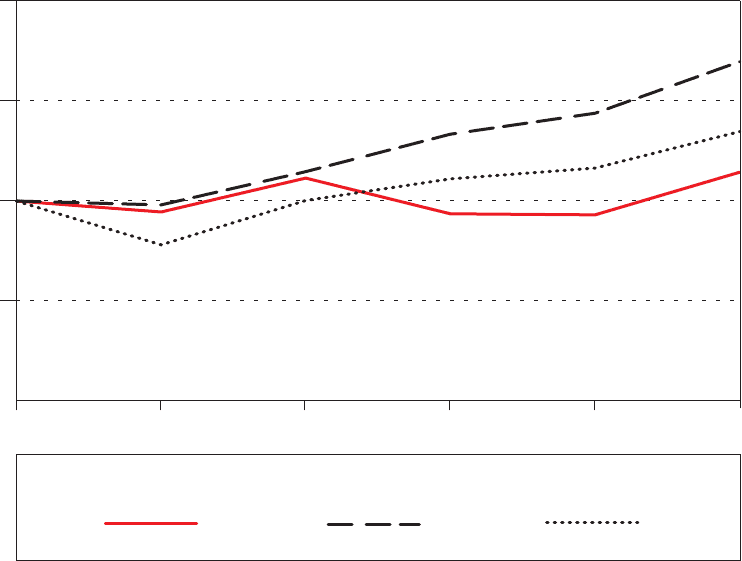
Performance Graph
Comparison of Five-Year Cumulative Total Return Among
The Coca-Cola Company, the Peer Group Index and the S&P 500 Index
Total Return
Stock Price Plus Reinvested Dividends
$0
$50
$100
$200
$150
12/31/0612/31/0512/31/0412/31/0312/31/0212/31/01
KO Peer
Group
S&P
12/31/01 $100 $100 $100
12/31/02 $ 94 $ 98 $ 78
12/31/03 $112 $115 $100
12/31/04 $ 94 $134 $111
12/31/05 $ 93 $144 $117
12/31/06 $115 $170 $135
Peer Group
Index
(FBT)
The S&P
500
(S&P)
$135
$170
$115
The Coca-Cola
Company
(KO)
The total return assumes that dividends were reinvested quarterly and is based on a $100 investment on
December 31, 2001.
The Peer Group Index is a self-constructed peer group of companies included in the Food, Beverage and
Tobacco Groups of companies as published in The Wall Street Journal, from which the Company has been
excluded.
The Peer Group Index consists of the following companies: Altria Group, Inc., Anheuser-Busch
Companies, Inc., Archer-Daniels-Midland Company, Brown-Forman Corporation, Bunge Limited, Campbell
Soup Company, Loews Corporation (Carolina Group tracking stock), Chiquita Brands International, Inc.,
Coca-Cola Enterprises Inc., ConAgra Foods, Inc., Constellation Brands, Inc., Corn Products International, Inc.,
Dean Foods Company, Del Monte Foods Company, Flowers Foods, Inc., General Mills, Inc., Hansen Natural
Corporation, Herbalife Ltd., H.J. Heinz Company, Hormel Foods Corporation, Kellogg Company, Kraft
Foods Inc., Lancaster Colony Corporation, Martek Biosciences Corporation, McCormick & Company,
Incorporated, Molson Coors Brewing Company, NBTY, Inc., Nu Skin Enterprises, Inc., Nutrisystem, Inc.,
PepsiAmericas, Inc., PepsiCo, Inc., Ralcorp Holdings, Inc., Reynolds American Inc., Sara Lee Corporation,
Smithfield Foods, Inc., The Hain Celestial Group, Inc., The Hershey Company, The J.M. Smucker Company,
The Pepsi Bottling Group, Inc., Tootsie Roll Industries, Inc., TreeHouse Foods, Inc., Tyson Foods, Inc.,
Universal Corporation, UST Inc., Weight Watchers International, Inc. and Wm. Wrigley Jr. Company. The Wall
Street Journal periodically changes the companies reported as a part of the Food, Beverage and Tobacco Groups
of companies. This year, the Groups include Hansen Natural Corporation, Herbalife Ltd., Nu Skin
Enterprises, Inc. and Nutrisystem, Inc., which were not included in the Groups last year. Dreyer’s Grand Ice
Cream Holdings, Inc., which was included in the Groups last year, is not included in the Groups this year.
30