General Motors 2015 Annual Report Download - page 107
Download and view the complete annual report
Please find page 107 of the 2015 General Motors annual report below. You can navigate through the pages in the report by either clicking on the pages listed below, or by using the keyword search tool below to find specific information within the annual report.-
 1
1 -
2
-
3
-
4
-
5
-
6
-
7
-
8
-
9
-
10
-
11
-
12
-
13
-
14
-
15
-
16
-
17
-
18
-
19
-
20
-
21
-
22
-
23
-
24
-
25
-
26
-
27
-
28
-
29
-
30
-
31
-
32
-
33
-
34
-
35
-
36
-
37
-
38
-
39
-
40
-
41
-
42
-
43
-
44
-
45
-
46
-
47
-
48
-
49
-
50
-
51
-
52
-
53
-
54
-
55
-
56
-
57
-
58
-
59
-
60
-
61
-
62
-
63
-
64
-
65
-
66
-
67
-
68
-
69
-
70
-
71
-
72
-
73
-
74
-
75
-
76
-
77
-
78
-
79
-
80
-
81
-
82
-
83
-
84
-
85
-
86
-
87
-
88
-
89
-
90
-
91
-
92
-
93
-
94
-
95
-
96
-
 97
97 -
 98
98 -
 99
99 -
 100
100 -
 101
101 -
 102
102 -
 103
103 -
 104
104 -
 105
105 -
 106
106 -
 107
107 -
 108
108 -
 109
109 -
 110
110 -
 111
111 -
 112
112 -
 113
113 -
 114
114 -
 115
115 -
 116
116 -
 117
117 -
118
-
119
-
120
-
121
-
122
-
123
-
124
-
125
-
126
-
127
-
128
-
129
-
130
-
131
-
132
-
133
-
134
-
135
-
136
-
137
-
138
-
139
-
140
-
141
-
142
-
143
-
144
-
145
-
146
-
147
-
148
-
149
-
150
-
151
-
152
-
153
-
154
-
155
-
156
-
157
-
158
-
159
-
160
-
161
-
162
 |
 |
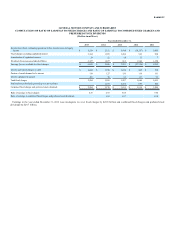
Table of Contents
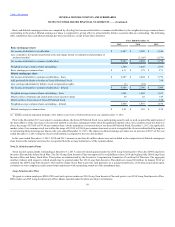
Net sales and revenue $ 95,099
$ 21,962
$ 18,411
$ 16,478
$ 150
$ 152,100
$ 3,344
$ (17)
$ 155,427
Income (loss) before interest and taxes-
adjusted $ 7,461
$ (869)
$ 1,255
$ 327
$ (494)
$ 7,680
$ 898
$ —
$ 8,578
Adjustments(a) $ (100)
$ 153
$ (1,169)
$ (157)
$ 483
$ (790)
$ (15)
$ —
(805)
Automotive interest income
246
Automotive interest expense
(334)
Loss on extinguishment of debt
(212)
Net loss attributable to noncontrolling
interests
(15)
Income before income taxes
7,458
Income tax expense
(2,127)
Net loss attributable to noncontrolling
interests
15
Net income attributable to stockholders
$ 5,346
Equity in net assets of nonconsolidated
affiliates $ 74
$ 95
$ 7,921
$ 4
$ —
$ —
$ 8,094
$ —
$ —
$ 8,094
Total assets $ 87,978
$ 11,276
$ 22,100
$ 11,488
$ 26,421
$ (29,252)
$ 130,011
$ 38,010
$ (1,790)
$ 166,231
Expenditures for property $ 5,466
$ 818
$ 724
$ 444
$ 92
$ 5
$ 7,549
$ 16
$ —
$ 7,565
Depreciation and amortization $ 3,896
$ 291
$ 694
$ 477
$ 63
$ (1)
$ 5,420
$ 498
$ (10)
$ 5,908
Impairment charges, excluding goodwill $ 320
$ 135
$ 1,092
$ 45
$ —
$ —
$ 1,592
$ —
$ —
$ 1,592
Equity income $ 15
$ 34
$ 1,760
$ 1
$ —
$ —
$ 1,810
$ —
$ —
$ 1,810
__________
(a) Consists of pension settlement charges of $56 million and charges related to PSA product development agreement of $49 million in GMNA; gain on sale of equity investment in PSA of $152 million in GME;
property and intangible asset impairment charges of $774 million, costs related to the withdrawal of the Chevrolet brand in Europe of $621 million and goodwill impairment charges of $442 million, partially offset
by GM Korea hourly wage litigation of $577 million and acquisition of GM Korea preferred shares of $67 million in GMIO, all net of noncontrolling interests; Venezuela currency devaluation charges of $162
million in GMSA; gain on sale of equity investment in Ally Financial of $483 million in Corporate; costs related to the withdrawal of the Chevrolet brand in Europe of $15 million in GM Financial; and income
related to various insurance recoveries of $35 million.
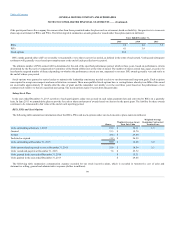
Automotive revenue is attributed to geographic areas based on the country in which our subsidiary is located. Automotive Financing revenue is attributed
to the geographic area where the financing is originated. The following table summarizes information concerning principal geographic areas (dollars in
millions):
Automotive
U.S. $ 100,008
$ 21,091
$ 93,559
$ 18,813
$ 88,784
$ 15,844
Non-U.S. 45,914
12,742
57,533
12,355
63,308
12,289
GM Financial
U.S. 4,357
18,501
2,549
5,477
2,233
2,472
Non-U.S. 2,077
1,890
2,288
1,755
1,102
1,043
Total consolidated $ 152,356
$ 54,224
$ 155,929
$ 38,400
$ 155,427
$ 31,648
No individual country other than the U.S. represented more than 10% of our total Net sales and revenue or Long-lived assets.
The following table summarizes the sources (uses) of cash provided by Change in other operating assets and liabilities and Cash paid for income taxes and
interest (dollars in millions):
103