General Motors 2015 Annual Report Download - page 23
Download and view the complete annual report
Please find page 23 of the 2015 General Motors annual report below. You can navigate through the pages in the report by either clicking on the pages listed below, or by using the keyword search tool below to find specific information within the annual report.-
 1
1 -
2
-
3
-
4
-
5
-
6
-
7
-
8
-
9
-
10
-
11
-
12
-
 13
13 -
 14
14 -
 15
15 -
 16
16 -
 17
17 -
 18
18 -
 19
19 -
 20
20 -
 21
21 -
 22
22 -
 23
23 -
 24
24 -
 25
25 -
 26
26 -
 27
27 -
 28
28 -
 29
29 -
 30
30 -
 31
31 -
 32
32 -
 33
33 -
34
-
35
-
36
-
37
-
38
-
39
-
40
-
41
-
42
-
43
-
44
-
45
-
46
-
47
-
48
-
49
-
50
-
51
-
52
-
53
-
54
-
55
-
56
-
57
-
58
-
59
-
60
-
61
-
62
-
63
-
64
-
65
-
66
-
67
-
68
-
69
-
70
-
71
-
72
-
73
-
74
-
75
-
76
-
77
-
78
-
79
-
80
-
81
-
82
-
83
-
84
-
85
-
86
-
87
-
88
-
89
-
90
-
91
-
92
-
93
-
94
-
95
-
96
-
97
-
98
-
99
-
100
-
101
-
102
-
103
-
104
-
105
-
106
-
107
-
108
-
109
-
110
-
111
-
112
-
113
-
114
-
115
-
116
-
117
-
118
-
119
-
120
-
121
-
122
-
123
-
124
-
125
-
126
-
127
-
128
-
129
-
130
-
131
-
132
-
133
-
134
-
135
-
136
-
137
-
138
-
139
-
140
-
141
-
142
-
143
-
144
-
145
-
146
-
147
-
148
-
149
-
150
-
151
-
152
-
153
-
154
-
155
-
156
-
157
-
158
-
159
-
160
-
161
-
162
 |
 |

Table of Contents
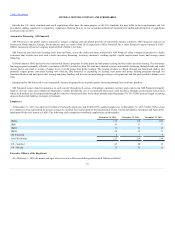
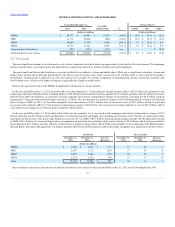
Selected financial data is summarized in the following table (dollars in millions except per share amounts):
Total net sales and revenue $ 152,356
$ 155,929
$ 155,427
$ 152,256
$ 150,276
Net income(a) $ 9,615
$ 4,018
$ 5,331
$ 6,136
$ 9,287
Net income attributable to stockholders $ 9,687
$ 3,949
$ 5,346
$ 6,188
$ 9,190
Net income attributable to common stockholders(b) $ 9,687
$ 2,804
$ 3,770
$ 4,859
$ 7,585
Basic earnings per common share(a)(b)(c) $ 6.11
$ 1.75
$ 2.71
$ 3.10
$ 4.94
Diluted earnings per common share(a)(b)(c) $ 5.91
$ 1.65
$ 2.38
$ 2.92
$ 4.58
Dividends declared per common share $ 1.38
$ 1.20
$ —
$ —
$ —
Total assets(d) $ 194,520
$ 177,501
$ 166,231
$ 149,422
$ 144,603
Automotive notes and loans payable $ 8,765
$ 9,350
$ 7,098
$ 5,172
$ 5,295
GM Financial notes and loans payable(d) $ 54,346
$ 37,315
$ 28,972
$ 10,878
$ 8,538
Series A Preferred Stock(b)
$ —
$ 3,109
$ 5,536
$ 5,536
Series B Preferred Stock(e)
$ —
$ 4,855
$ 4,855
Total equity $ 40,323
$ 36,024
$ 43,174
$ 37,000
$ 38,991
_________
(a) In the year ended December 31, 2015 we recorded the reversal of deferred tax asset valuation allowances of $3.9 billion in GME and recorded charges related to the Ignition
Switch Recall for various legal matters of approximately $1.6 billion. In the year ended December 31, 2014 we recorded charges of approximately $2.9 billion in Automotive
cost of sales related to recall campaigns and courtesy transportation, a catch-up adjustment of $0.9 billion recorded related to the change in estimate for recall campaigns and a
charge of $0.4 billion related to the Ignition Switch Recall compensation program. In the year ended December 31, 2012 we recorded Goodwill impairment charges of $27.1
billion, the reversal of deferred tax asset valuation allowances of $36.3 billion in the U.S. and Canada, pension settlement charges of $2.7 billion and GME long-lived asset
impairment charges of $5.5 billion.
(b) In December 2014 we redeemed all of the remaining shares of our Series A Preferred Stock for $3.9 billion, which reduced Net income attributable to common stockholders
by $0.8 billion. In September 2013 we purchased 120 million shares of our Series A Preferred Stock held by the UAW Retiree Medical Benefits Trust (New VEBA) for $3.2
billion, which reduced Net income attributable to common stockholders by $0.8 billion.
(c) In the year ended December 31, 2012 we used the two-class method for calculating earnings per share as the Series B Preferred Stock was a participating security. Refer to
Note 20 to our consolidated financial statements for additional detail.
(d) In the year ended December 31, 2013 GM Financial acquired Ally Financial's international operations in Europe and Latin America.
(e) In December 2013 all of our Series B Preferred Stock automatically converted into 137 million shares of our common stock.
* * * * * * *
This MD&A should be read in conjunction with the accompanying consolidated financial statements.
Management uses earnings before interest and taxes (EBIT)-adjusted to review the operating results of our automotive segments because it excludes
interest income, interest expense and income taxes as well as certain additional adjustments. GM Financial uses income before income taxes-adjusted
because management believes interest income and interest expense are part of operating results when assessing and measuring the operational and financial
performance of the segment. Examples of adjustments to EBIT and GM Financial's income before income taxes include certain impairment charges related to
goodwill, other long-lived assets and investments; certain gains or losses on the settlement/extinguishment of obligations; and gains or losses on the sale of
non-core investments. Refer to Note 23 to our consolidated financial statements for our reconciliation of these non-GAAP measures to the most directly
comparable financial measure under U.S. GAAP, Net income attributable to stockholders.
Management uses earnings per share (EPS)-diluted-adjusted to review our consolidated diluted earnings per share results on a consistent basis. EPS-
diluted-adjusted is calculated as net income attributable to common stockholders less certain adjustments
20