General Motors 2015 Annual Report Download - page 34
Download and view the complete annual report
Please find page 34 of the 2015 General Motors annual report below. You can navigate through the pages in the report by either clicking on the pages listed below, or by using the keyword search tool below to find specific information within the annual report.-
 1
1 -
2
-
3
-
4
-
5
-
6
-
7
-
8
-
9
-
10
-
11
-
12
-
13
-
14
-
15
-
16
-
17
-
18
-
19
-
20
-
21
-
22
-
23
-
 24
24 -
 25
25 -
 26
26 -
 27
27 -
 28
28 -
 29
29 -
 30
30 -
 31
31 -
 32
32 -
 33
33 -
 34
34 -
 35
35 -
 36
36 -
 37
37 -
 38
38 -
 39
39 -
 40
40 -
 41
41 -
 42
42 -
 43
43 -
 44
44 -
45
-
46
-
47
-
48
-
49
-
50
-
51
-
52
-
53
-
54
-
55
-
56
-
57
-
58
-
59
-
60
-
61
-
62
-
63
-
64
-
65
-
66
-
67
-
68
-
69
-
70
-
71
-
72
-
73
-
74
-
75
-
76
-
77
-
78
-
79
-
80
-
81
-
82
-
83
-
84
-
85
-
86
-
87
-
88
-
89
-
90
-
91
-
92
-
93
-
94
-
95
-
96
-
97
-
98
-
99
-
100
-
101
-
102
-
103
-
104
-
105
-
106
-
107
-
108
-
109
-
110
-
111
-
112
-
113
-
114
-
115
-
116
-
117
-
118
-
119
-
120
-
121
-
122
-
123
-
124
-
125
-
126
-
127
-
128
-
129
-
130
-
131
-
132
-
133
-
134
-
135
-
136
-
137
-
138
-
139
-
140
-
141
-
142
-
143
-
144
-
145
-
146
-
147
-
148
-
149
-
150
-
151
-
152
-
153
-
154
-
155
-
156
-
157
-
158
-
159
-
160
-
161
-
162
 |
 |

Table of Contents
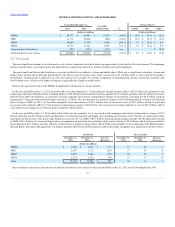
Total net sales and revenue $ 18,704 $ 22,235 $ (3,531) (15.9)% $ (0.7) $ (0.1) $ 0.6 $ (3.3)
EBIT (loss)-adjusted $ (813) $ (1,369) $ 556 40.6 % $ (0.2) $ (0.1) $ 0.8 $ 0.1
Wholesale vehicle sales 1,127
1,172
(45)
(3.8)%
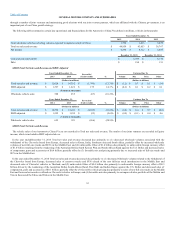
Total net sales and revenue $ 22,235 $ 21,962 $ 273 1.2 % $ 0.2 $ 0.7 $ — $ (0.5)
EBIT (loss)-adjusted $ (1,369) $ (869) $ (500) (57.5)% $ — $ 0.2 $ — $ (0.7)
Wholesale vehicle sales 1,172
1,163
9
0.8 %
In the year ended December 31, 2015 Total net sales and revenue decreased due primarily to: (1) decreased net wholesale volumes associated with
decreases across the Russian portfolio and lower demand for the Zafira multipurpose vehicle across the region, partially offset by higher demand primarily for
the Vivaro commercial van, the Mokka crossover and the Astra and the recently launched KARL passenger vehicles across the region; and (2) unfavorable
Other of $3.3 billion due primarily to unfavorable foreign currency effect due to the weakening of the Euro, British Pound and Russian Ruble against the U.S.
Dollar; partially offset by (3) favorable pricing primarily related to the next generation Corsa passenger vehicle and Vivaro and the recently launched next
generation Astra.
In the year ended December 31, 2014 Total net sales and revenue increased due primarily to: (1) favorable vehicle mix due to increased sales of higher
priced vehicles; and (2) increased net wholesale volumes associated with higher demand primarily for the Mokka across the region and the Corsa and
Insignia passenger vehicle in Germany, Spain, United Kingdom, Italy and Poland, partially offset by decreases across the Russian portfolio and lower demand
for the Astra primarily in Germany, United Kingdom and Turkey; partially offset by (3) unfavorable Other of $0.5 billion due primarily to net foreign
currency effect related to the weakening of the Russian Ruble against the U.S. Dollar, partially offset by the strengthening of the British Pound against the
U.S. Dollar.
In the year ended December 31, 2015 EBIT (loss)-adjusted decreased due primarily to: (1) favorable pricing; and (2) favorable Other of $0.1 billion due
primarily to a net decrease in restructuring related charges of $0.7 billion, partially offset by unfavorable material costs of $0.2 billion primarily related to the
next generation Corsa and Vivaro and unfavorable foreign currency effect of $0.2 billion; partially offset by (3) decreased net wholesale volumes.
In the year ended December 31, 2014 EBIT (loss)-adjusted increased due primarily to: (1) unfavorable Other of $0.7 billion due primarily to restructuring
related charges of $0.5 billion, unfavorable net foreign currency effect of $0.3 billion due primarily to the weakening of the Russian Ruble against the U.S.
Dollar, partially offset by the strengthening of the British Pound against the U.S. Dollar, and unfavorable net effect of changes in the fair value of an
embedded foreign currency derivative asset of $0.1 billion associated with a long-term supply agreement, partially offset by decreased material and freight
costs of $0.2 billion; partially offset by (2) favorable net vehicle mix.
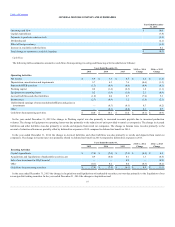
We view the Chinese market as important to our global growth strategy and are employing a multi-brand strategy, led by our Buick and Chevrolet brands.
In the coming years we plan to increasingly leverage our global architectures to increase the number of product offerings under the Buick, Chevrolet and
Cadillac brands in China and continue to grow our business under the local Baojun and Wuling brands with Baojun seizing the growth opportunities in less
developed cities and markets. We operate in the Chinese market
31