General Motors 2015 Annual Report Download - page 29
Download and view the complete annual report
Please find page 29 of the 2015 General Motors annual report below. You can navigate through the pages in the report by either clicking on the pages listed below, or by using the keyword search tool below to find specific information within the annual report.-
 1
1 -
2
-
3
-
4
-
5
-
6
-
7
-
8
-
9
-
10
-
11
-
12
-
13
-
14
-
15
-
16
-
17
-
18
-
 19
19 -
 20
20 -
 21
21 -
 22
22 -
 23
23 -
 24
24 -
 25
25 -
 26
26 -
 27
27 -
 28
28 -
 29
29 -
 30
30 -
 31
31 -
 32
32 -
 33
33 -
 34
34 -
 35
35 -
 36
36 -
 37
37 -
 38
38 -
 39
39 -
40
-
41
-
42
-
43
-
44
-
45
-
46
-
47
-
48
-
49
-
50
-
51
-
52
-
53
-
54
-
55
-
56
-
57
-
58
-
59
-
60
-
61
-
62
-
63
-
64
-
65
-
66
-
67
-
68
-
69
-
70
-
71
-
72
-
73
-
74
-
75
-
76
-
77
-
78
-
79
-
80
-
81
-
82
-
83
-
84
-
85
-
86
-
87
-
88
-
89
-
90
-
91
-
92
-
93
-
94
-
95
-
96
-
97
-
98
-
99
-
100
-
101
-
102
-
103
-
104
-
105
-
106
-
107
-
108
-
109
-
110
-
111
-
112
-
113
-
114
-
115
-
116
-
117
-
118
-
119
-
120
-
121
-
122
-
123
-
124
-
125
-
126
-
127
-
128
-
129
-
130
-
131
-
132
-
133
-
134
-
135
-
136
-
137
-
138
-
139
-
140
-
141
-
142
-
143
-
144
-
145
-
146
-
147
-
148
-
149
-
150
-
151
-
152
-
153
-
154
-
155
-
156
-
157
-
158
-
159
-
160
-
161
-
162
 |
 |

Table of Contents
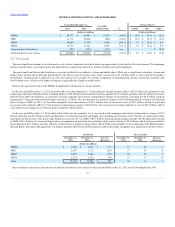
We review changes in our results of operations under four categories: volume, mix, price and other. Volume measures the impact of changes in wholesale
vehicle volumes driven by industry volume, market share and changes in dealer stock levels. Mix measures the impact of changes to the regional portfolio
due to product, model, trim, country and option penetration in current year wholesale vehicle volumes. Price measures the impact of changes related to
Manufacturer’s Suggested Retail Price and various sales allowances. Other includes primarily: (1) material and freight; (2) costs including manufacturing,
engineering, advertising, administrative and selling and policy and warranty expense; (3) foreign exchange; and (4) non-vehicle related automotive revenues
and costs as well as equity income or loss from our nonconsolidated affiliates.
GMNA $ 106,622
$ 101,199
$ 5,423
5.4 %
$ 6.8
$ 1.0
$ (1.1)
$ (1.2)
GME 18,704
22,235
(3,531)
(15.9)%
$ (0.7)
$ (0.1)
$ 0.6
$ (3.3)
GMIO 12,626
14,392
(1,766)
(12.3)%
$ (1.2)
$ 0.7
$ 0.1
$ (1.4)
GMSA 7,820
13,115
(5,295)
(40.4)%
$ (3.9)
$ 0.6
$ 0.9
$ (2.9)
Corporate and eliminations 150
151
(1)
(0.7)%
$ —
Automotive 145,922
151,092
(5,170)
(3.4)%
$ 1.0
$ 2.1
$ 0.6
$ (8.8)
GM Financial 6,434
4,837
1,597
33.0 %
$ 1.6
Total net sales and revenue $ 152,356
$ 155,929
$ (3,573)
(2.3)%
$ 1.0
$ 2.1
$ 0.6
$ (7.2)
GMNA $ 101,199
$ 95,099
$ 6,100
6.4 %
$ 1.3
$ 1.2
$ 3.4
$ 0.3
GME 22,235
21,962
273
1.2 %
$ 0.2
$ 0.7
$ —
$ (0.5)
GMIO 14,392
18,411
(4,019)
(21.8)%
$ (4.6)
$ 0.4
$ 0.7
$ (0.4)
GMSA 13,115
16,478
(3,363)
(20.4)%
$ (2.4)
$ 0.1
$ 1.1
$ (2.1)
Corporate and eliminations 151
142
9
6.3 %
$ —
Automotive 151,092
152,092
(1,000)
(0.7)%
$ (5.6)
$ 2.3
$ 5.1
$ (2.8)
GM Financial 4,837
3,335
1,502
45.0 %
$ 1.5
Total net sales and revenue $ 155,929
$ 155,427
$ 502
0.3 %
$ (5.6)
$ 2.3
$ 5.1
$ (1.3)
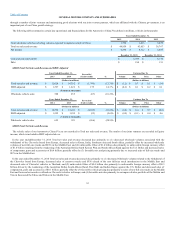
Refer to the regional sections of the MD&A for additional information.
GMNA $ 89,173
$ 89,371
$ 198
0.2%
$ (4.7)
$ (0.5)
$ 5.4
GME 18,062
21,712
3,650
16.8%
$ 0.6
$ —
$ 3.1
GMIO 12,506
14,009
1,503
10.7%
$ 1.0
$ (0.6)
$ 1.1
GMSA 8,416
12,736
4,320
33.9%
$ 3.2
$ (0.5)
$ 1.6
Corporate and eliminations 164
254
90
35.4%
$ 0.1
Total automotive cost of sales $ 128,321
$ 138,082
$ 9,761
7.1%
$ —
$ (1.5)
$ 11.3
26