General Motors 2015 Annual Report Download - page 59
Download and view the complete annual report
Please find page 59 of the 2015 General Motors annual report below. You can navigate through the pages in the report by either clicking on the pages listed below, or by using the keyword search tool below to find specific information within the annual report.-
 1
1 -
2
-
3
-
4
-
5
-
6
-
7
-
8
-
9
-
10
-
11
-
12
-
13
-
14
-
15
-
16
-
17
-
18
-
19
-
20
-
21
-
22
-
23
-
24
-
25
-
26
-
27
-
28
-
29
-
30
-
31
-
32
-
33
-
34
-
35
-
36
-
37
-
38
-
39
-
40
-
41
-
42
-
43
-
44
-
45
-
46
-
47
-
48
-
 49
49 -
 50
50 -
 51
51 -
 52
52 -
 53
53 -
 54
54 -
 55
55 -
 56
56 -
 57
57 -
 58
58 -
 59
59 -
 60
60 -
 61
61 -
 62
62 -
 63
63 -
 64
64 -
 65
65 -
 66
66 -
 67
67 -
 68
68 -
 69
69 -
70
-
71
-
72
-
73
-
74
-
75
-
76
-
77
-
78
-
79
-
80
-
81
-
82
-
83
-
84
-
85
-
86
-
87
-
88
-
89
-
90
-
91
-
92
-
93
-
94
-
95
-
96
-
97
-
98
-
99
-
100
-
101
-
102
-
103
-
104
-
105
-
106
-
107
-
108
-
109
-
110
-
111
-
112
-
113
-
114
-
115
-
116
-
117
-
118
-
119
-
120
-
121
-
122
-
123
-
124
-
125
-
126
-
127
-
128
-
129
-
130
-
131
-
132
-
133
-
134
-
135
-
136
-
137
-
138
-
139
-
140
-
141
-
142
-
143
-
144
-
145
-
146
-
147
-
148
-
149
-
150
-
151
-
152
-
153
-
154
-
155
-
156
-
157
-
158
-
159
-
160
-
161
-
162
 |
 |

Table of Contents
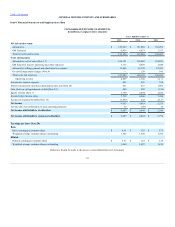
Net income $ 9,615
$ 4,018
$ 5,331
Depreciation, amortization and impairment charges 8,017
7,238
8,041
Foreign currency remeasurement and transaction losses 829
437
350
Amortization of discount and issuance costs on debt issues 176
181
114
Undistributed earnings of nonconsolidated affiliates and gains on investments (147)
(301)
(92)
Pension contributions and OPEB payments (1,600)
(1,315)
(1,458)
Pension and OPEB expense, net 321
439
638
(Gains) losses on extinguishment of debt (449)
(202)
212
Provision (benefit) for deferred taxes (2,757)
(574)
1,561
Change in other operating assets and liabilities (Note 24) (1,754)
244
(1,326)
Other operating activities (273)
(107)
(741)
11,978
10,058
12,630
Expenditures for property (7,874)
(7,091)
(7,565)
Available-for-sale marketable securities, acquisitions (8,113)
(7,636)
(6,754)
Trading marketable securities, acquisitions (1,250)
(1,518)
(3,214)
Available-for-sale marketable securities, liquidations 8,463
6,874
3,566
Trading marketable securities, liquidations 1,758
1,881
6,538
Acquisition of companies/investments, net of cash acquired (928)
(53)
(2,623)
Proceeds from sale of business units/investments, net of cash disposed —
—
896
Increase in restricted cash and marketable securities (744)
(839)
(984)
Decrease in restricted cash and marketable securities 376
515
1,107
Purchases of finance receivables (17,495)
(14,744)
(10,838)
Principal collections and recoveries on finance receivables 11,726
10,860
7,555
Purchases of leased vehicles, net (15,158)
(4,776)
(2,254)
Proceeds from termination of leased vehicles 1,096
533
217
Other investing activities 108
296
(9)
(28,035)
(15,698)
(14,362)
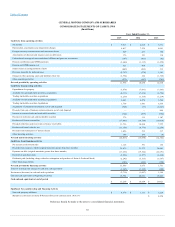
Net increase in short-term debt 1,128
391
156
Proceeds from issuance of debt (original maturities greater than three months) 35,679
31,373
28,041
Payments on debt (original maturities greater than three months) (17,256)
(19,524)
(20,191)
Payments to purchase stock (3,520)
(3,277)
(2,438)
Dividends paid (including charge related to redemption and purchase of Series A Preferred Stock) (2,242)
(3,165)
(1,687)
Other financing activities (103)
(123)
(150)
13,686
5,675
3,731
Effect of exchange rate changes on cash and cash equivalents (1,345)
(1,102)
(400)
Net increase (decrease) in cash and cash equivalents (3,716)
(1,067)
1,599
Cash and cash equivalents at beginning of period 18,954
20,021
18,422
$ 15,238
$ 18,954
$ 20,021
Non-cash property additions $ 4,676
$ 3,313
$ 3,224
Mandatory conversion of Series B Preferred Stock into common stock (Note 19)
$ 4,854
Reference should be made to the notes to consolidated financial statements.
55