General Motors 2015 Annual Report Download - page 45
Download and view the complete annual report
Please find page 45 of the 2015 General Motors annual report below. You can navigate through the pages in the report by either clicking on the pages listed below, or by using the keyword search tool below to find specific information within the annual report.-
 1
1 -
2
-
3
-
4
-
5
-
6
-
7
-
8
-
9
-
10
-
11
-
12
-
13
-
14
-
15
-
16
-
17
-
18
-
19
-
20
-
21
-
22
-
23
-
24
-
25
-
26
-
27
-
28
-
29
-
30
-
31
-
32
-
33
-
34
-
 35
35 -
 36
36 -
 37
37 -
 38
38 -
 39
39 -
 40
40 -
 41
41 -
 42
42 -
 43
43 -
 44
44 -
 45
45 -
 46
46 -
 47
47 -
 48
48 -
 49
49 -
 50
50 -
 51
51 -
 52
52 -
 53
53 -
 54
54 -
 55
55 -
56
-
57
-
58
-
59
-
60
-
61
-
62
-
63
-
64
-
65
-
66
-
67
-
68
-
69
-
70
-
71
-
72
-
73
-
74
-
75
-
76
-
77
-
78
-
79
-
80
-
81
-
82
-
83
-
84
-
85
-
86
-
87
-
88
-
89
-
90
-
91
-
92
-
93
-
94
-
95
-
96
-
97
-
98
-
99
-
100
-
101
-
102
-
103
-
104
-
105
-
106
-
107
-
108
-
109
-
110
-
111
-
112
-
113
-
114
-
115
-
116
-
117
-
118
-
119
-
120
-
121
-
122
-
123
-
124
-
125
-
126
-
127
-
128
-
129
-
130
-
131
-
132
-
133
-
134
-
135
-
136
-
137
-
138
-
139
-
140
-
141
-
142
-
143
-
144
-
145
-
146
-
147
-
148
-
149
-
150
-
151
-
152
-
153
-
154
-
155
-
156
-
157
-
158
-
159
-
160
-
161
-
162
 |
 |

Table of Contents
plans' asset mix. While the studies give appropriate consideration to recent plan performance and historical returns, the assumptions are primarily long-term,
prospective rates of return.
In December 2015 an investment policy study was completed for the U.S. pension plans. The study resulted in new target asset allocations being approved
for the U.S. pension plans with resulting changes to the expected long-term rate of return on assets. The weighted-average long-term rate of return on assets
decreased from 6.4% at December 31, 2014 to 6.3% at December 31, 2015. The expected long-term rate of return on plan assets used in determining pension
expense for non-U.S. plans is determined in a similar manner to the U.S. plans.
Another key assumption in determining net pension and OPEB expense is the assumed discount rate used to discount plan obligations. We estimate the
assumed discount rate for U.S. plans using a cash flow matching approach, which uses projected cash flows matched to spot rates along a high quality
corporate yield curve to determine the present value of cash flows. Effective 2016 we will apply the individual annual yield curve rates instead of the
assumed discount rate to determine the service cost and interest cost. This refinement more specifically links the cash flows related to service cost and interest
cost to bonds maturing in their year of payment. The refinement had no effect on service cost or interest cost in the year ended December 31, 2015 but will
reduce the service cost and interest cost in 2016 by approximately $0.8 billion. There will be no effect on the determination of the plan obligations which
will continue to be calculated using the assumed discount rate.
We have reviewed the mortality improvement tables published by the Society of Actuaries in the three months ended December 31, 2015 and determined
our current assumptions are appropriate to measure our December 31, 2015 U.S. pension plans’ benefit obligations.
Significant differences in actual experience or significant changes in assumptions may materially affect the pension obligations. The effects of actual
results differing from assumptions and the changing of assumptions are included in unamortized net actuarial gains and losses that are subject to amortization
to expense over future periods. The unamortized pre-tax actuarial loss on our pension plans was $3.7 billion and $4.6 billion at December 31, 2015 and 2014.
The change is primarily due to the increase in discount rates partially offset by actual asset returns less than assumed returns. At December 31, 2015 $2.0
billion of the unamortized pre-tax actuarial loss is outside the corridor (10% of the projected benefit obligation (PBO)) and subject to amortization. The
weighted-average amortization period is approximately 12 years resulting in amortization expense of $0.2 billion in 2016.
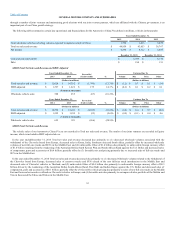
The underfunded status of the U.S. pension plans decreased by $0.5 billion in the year ended December 31, 2015 to $10.4 billion due primarily to: (1) a
favorable effect due to an increase in discount rates of $2.6 billion; (2) a favorable effect of actual returns on plan assets of $0.8 billion; and (3) favorable
contributions of $0.1 billion; partially offset by (4) interest and service cost of $3.0 billion.
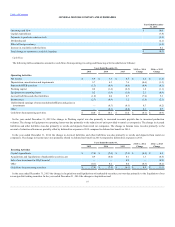
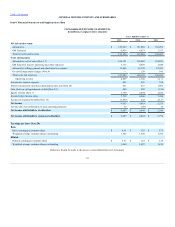
The following table illustrates the sensitivity to a change in certain assumptions for the pension plans, holding all other assumptions constant (dollars in
millions):
25 basis point decrease in discount rate -$58
+$1,907
+$13
+$780
25 basis point increase in discount rate +$55
-$1,821
-$12
-$746
25 basis point decrease in expected rate of return on assets +$149
N/A
+$30
N/A
25 basis point increase in expected rate of return on assets -$149
N/A
-$30
N/A
Refer to Note 13 to our consolidated financial statements for additional information on pension contributions, investment strategies, assumptions, the
change in benefit obligation and related plan assets, pension funding requirements and future net benefit payments. Refer to Note 2 to our consolidated
financial statements for a discussion of the inputs used to determine fair value for each significant asset class or category.
The ability to realize deferred tax assets depends on the ability to generate sufficient taxable income within the carryback or carryforward periods provided
for in the tax law for each applicable tax jurisdiction. The assessment regarding whether a valuation
42