General Motors 2015 Annual Report Download - page 83
Download and view the complete annual report
Please find page 83 of the 2015 General Motors annual report below. You can navigate through the pages in the report by either clicking on the pages listed below, or by using the keyword search tool below to find specific information within the annual report.-
 1
1 -
2
-
3
-
4
-
5
-
6
-
7
-
8
-
9
-
10
-
11
-
12
-
13
-
14
-
15
-
16
-
17
-
18
-
19
-
20
-
21
-
22
-
23
-
24
-
25
-
26
-
27
-
28
-
29
-
30
-
31
-
32
-
33
-
34
-
35
-
36
-
37
-
38
-
39
-
40
-
41
-
42
-
43
-
44
-
45
-
46
-
47
-
48
-
49
-
50
-
51
-
52
-
53
-
54
-
55
-
56
-
57
-
58
-
59
-
60
-
61
-
62
-
63
-
64
-
65
-
66
-
67
-
68
-
69
-
70
-
71
-
72
-
 73
73 -
 74
74 -
 75
75 -
 76
76 -
 77
77 -
 78
78 -
 79
79 -
 80
80 -
 81
81 -
 82
82 -
 83
83 -
 84
84 -
 85
85 -
 86
86 -
 87
87 -
 88
88 -
 89
89 -
 90
90 -
 91
91 -
 92
92 -
 93
93 -
94
-
95
-
96
-
97
-
98
-
99
-
100
-
101
-
102
-
103
-
104
-
105
-
106
-
107
-
108
-
109
-
110
-
111
-
112
-
113
-
114
-
115
-
116
-
117
-
118
-
119
-
120
-
121
-
122
-
123
-
124
-
125
-
126
-
127
-
128
-
129
-
130
-
131
-
132
-
133
-
134
-
135
-
136
-
137
-
138
-
139
-
140
-
141
-
142
-
143
-
144
-
145
-
146
-
147
-
148
-
149
-
150
-
151
-
152
-
153
-
154
-
155
-
156
-
157
-
158
-
159
-
160
-
161
-
162
 |
 |

Table of Contents
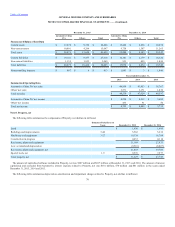
Beginning benefit obligation $ 76,724
$ 27,897
$ 6,625
$ 71,480
$ 27,528
$ 6,348
Service cost 272
405
24
247
358
23
Interest cost 2,754
763
238
3,060
1,031
273
Actuarial (gains) losses (2,623)
(256)
(209)
7,770
3,179
448
Benefits paid (5,641)
(1,332)
(407)
(5,779)
(1,699)
(426)
Foreign currency translation adjustments —
(3,332)
(225)
—
(2,536)
(108)
Curtailments, settlements and other —
(382)
20
(54)
36
67
Ending benefit obligation 71,486
23,763
6,066
76,724
27,897
6,625
Beginning fair value of plan assets 65,823
14,669
—
64,166
14,986
—
Actual return on plan assets 795
997
—
7,346
1,893
—
Employer contributions 95
1,120
385
143
770
402
Benefits paid (5,641)
(1,332)
(407)
(5,779)
(1,699)
(426)
Foreign currency translation adjustments —
(2,017)
—
—
(1,232)
—
Settlements and other —
(447)
22
(53)
(49)
24
Ending fair value of plan assets 61,072
12,990
—
65,823
14,669
—
Ending funded status $ (10,414)
$ (10,773)
$ (6,066)
$ (10,901)
$ (13,228)
$ (6,625)
Non-current assets $ —
$ 125
$ —
$ —
$ 111
$ —
Current liabilities (67)
(334)
(381)
(69)
(383)
(396)
Non-current liabilities (10,347)
(10,564)
(5,685)
(10,832)
(12,956)
(6,229)
Net amount recorded $ (10,414)
$ (10,773)
$ (6,066)
$ (10,901)
$ (13,228)
$ (6,625)
Net actuarial gain (loss) $ 116
$ (3,796)
$ (689)
$ 452
$ (5,019)
$ (942)
Net prior service (cost) credit 31
(33)
63
35
(57)
88
Total recorded in Accumulated other comprehensive loss $ 147
$ (3,829)
$ (626)
$ 487
$ (5,076)
$ (854)
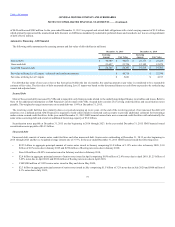
The following table summarizes the total accumulated benefit obligations (ABO), the ABO and fair value of plan assets for defined benefit pension plans
with ABO in excess of plan assets, and the PBO and fair value of plan assets for defined benefit pension plans with PBO in excess of plan assets (dollars in
millions):
ABO $ 71,475
$ 23,388
$ 76,702
$ 27,425
ABO $ 71,475
$ 22,683
$ 76,702
$ 26,510
Fair value of plan assets $ 61,072
$ 12,160
$ 65,823
$ 13,638
PBO $ 71,486
$ 23,052
$ 76,724
$ 26,935
Fair value of plan assets $ 61,072
$ 12,170
$ 65,823
$ 13,643
79