General Motors 2015 Annual Report Download - page 24
Download and view the complete annual report
Please find page 24 of the 2015 General Motors annual report below. You can navigate through the pages in the report by either clicking on the pages listed below, or by using the keyword search tool below to find specific information within the annual report.-
 1
1 -
2
-
3
-
4
-
5
-
6
-
7
-
8
-
9
-
10
-
11
-
12
-
13
-
 14
14 -
 15
15 -
 16
16 -
 17
17 -
 18
18 -
 19
19 -
 20
20 -
 21
21 -
 22
22 -
 23
23 -
 24
24 -
 25
25 -
 26
26 -
 27
27 -
 28
28 -
 29
29 -
 30
30 -
 31
31 -
 32
32 -
 33
33 -
 34
34 -
35
-
36
-
37
-
38
-
39
-
40
-
41
-
42
-
43
-
44
-
45
-
46
-
47
-
48
-
49
-
50
-
51
-
52
-
53
-
54
-
55
-
56
-
57
-
58
-
59
-
60
-
61
-
62
-
63
-
64
-
65
-
66
-
67
-
68
-
69
-
70
-
71
-
72
-
73
-
74
-
75
-
76
-
77
-
78
-
79
-
80
-
81
-
82
-
83
-
84
-
85
-
86
-
87
-
88
-
89
-
90
-
91
-
92
-
93
-
94
-
95
-
96
-
97
-
98
-
99
-
100
-
101
-
102
-
103
-
104
-
105
-
106
-
107
-
108
-
109
-
110
-
111
-
112
-
113
-
114
-
115
-
116
-
117
-
118
-
119
-
120
-
121
-
122
-
123
-
124
-
125
-
126
-
127
-
128
-
129
-
130
-
131
-
132
-
133
-
134
-
135
-
136
-
137
-
138
-
139
-
140
-
141
-
142
-
143
-
144
-
145
-
146
-
147
-
148
-
149
-
150
-
151
-
152
-
153
-
154
-
155
-
156
-
157
-
158
-
159
-
160
-
161
-
162
 |
 |
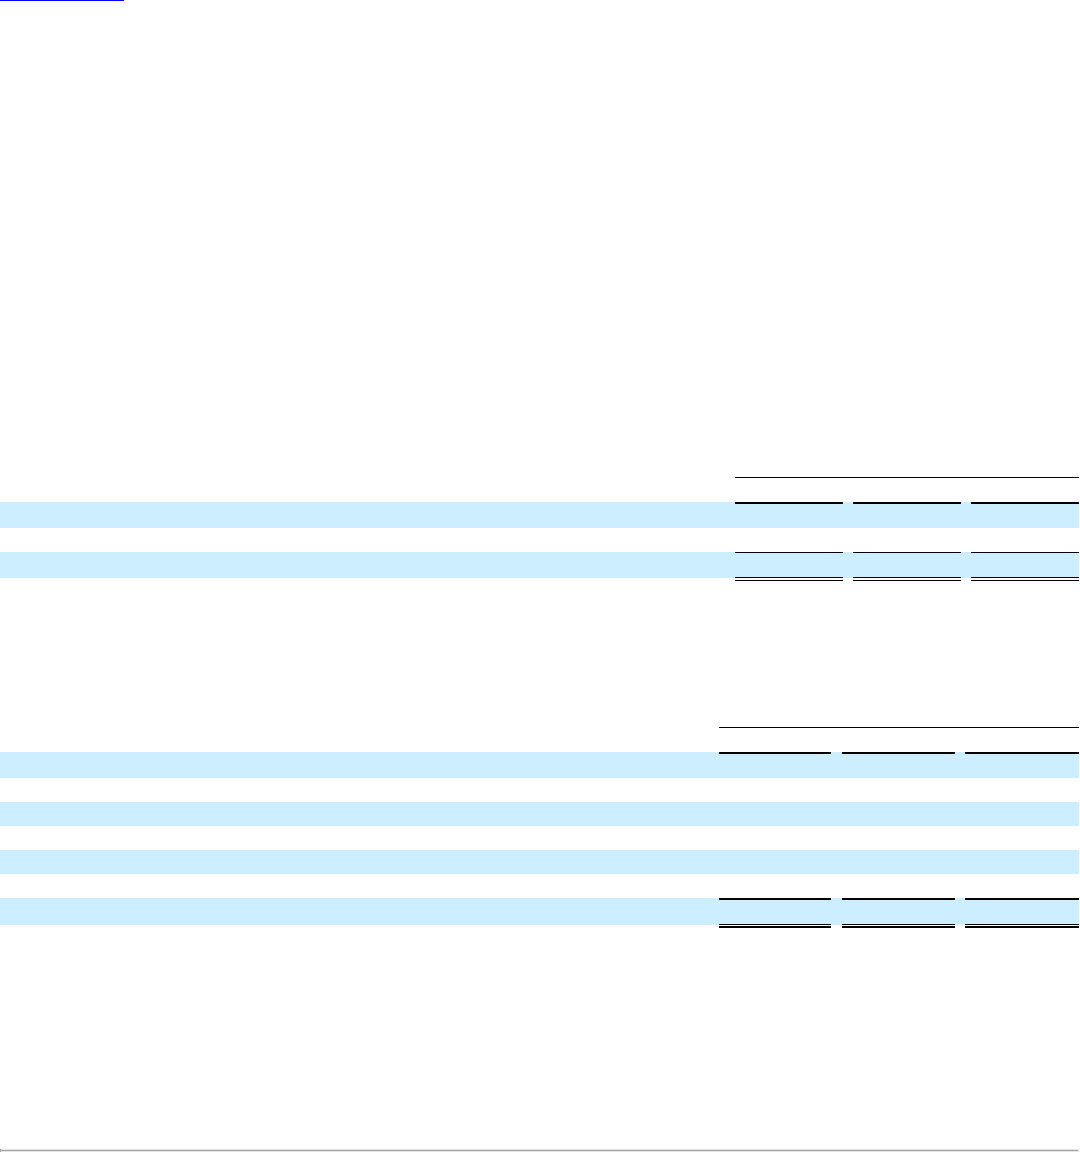
Table of Contents
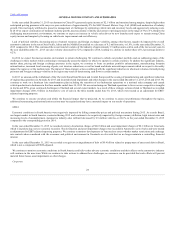
noted above for EBIT-adjusted on an after-tax basis as well as certain income tax adjustments divided by weighted-average common shares outstanding –
diluted.
Management uses return on invested capital (ROIC) to review investment and capital allocation decisions. We define ROIC as EBIT-adjusted for the
trailing four quarters divided by average net assets, which is considered to be the average equity balances adjusted for certain assets and liabilities during the
same period.
Management uses adjusted free cash flow to review the liquidity of our automotive operations. We measure adjusted free cash flow as cash flow from
operations less capital expenditures adjusted for management actions, primarily related to strengthening our balance sheet, such as accrued interest on
prepayments of debt and voluntary contributions to employee benefit plans. Refer to the “Liquidity and Capital Resources” section of MD&A for our
reconciliation of this non-GAAP measure to the most directly comparable financial measure under U.S. GAAP, Net cash provided by operating activities.
Management uses these non-GAAP measures in its financial and operational decision making processes, for internal reporting and as part of its forecasting
and budgeting processes as they provide additional transparency of our core operations. These measures allow management and investors to view operating
trends, perform analytical comparisons and benchmark performance between periods and among geographic regions.
Our calculation of these non-GAAP measures may not be comparable to similarly titled measures of other companies due to potential differences between
companies in the method of calculation. As a result the use of these non-GAAP measures has limitations and should not be considered superior to, in isolation
from, or as a substitute for, related U.S. GAAP measures.
The following table reconciles EPS-diluted-adjusted to its most comparable financial measure under U.S. GAAP diluted earnings per common share:
Diluted earnings per common share $ 5.91
$ 1.65
$ 2.38
Net impact of adjustments(a) (0.89)
1.40
0.80
EPS-diluted-adjusted $ 5.02
$ 3.05
$ 3.18
________
(a) Includes the adjustments disclosed in Note 23 to our consolidated financial statements on an after-tax basis for all periods presented, income tax benefit of $3.9 billion related
to the reversals of deferred tax asset valuation allowances primarily at GME in the year ended December 31, 2015 and income tax benefit of $0.5 billion related to income tax
settlements in the year ended December 31, 2013.
The following table summarizes the calculation of ROIC (dollars in billions):
$ 10.8
$ 6.5
$ 8.6
Average equity $ 37.0
$ 41.3
$ 39.5
Add: Average automotive debt and interest liabilities (excluding capital leases) 8.1
6.8
5.0
Add: Average automotive net pension & OPEB liability 28.3
26.6
32.6
Less: Average fresh start accounting goodwill
(0.1)
(0.5)
Less: Average automotive net income tax asset (33.6)
(32.4)
(34.1)
$ 39.8
$ 42.2
$ 42.5
27.2%
15.4%
20.2%
Our strategic plan includes several major initiatives that we anticipate will help us achieve 9% to 10% margins on an EBIT-adjusted basis (EBIT-adjusted
margins, calculated as EBIT-adjusted divided by Net sales and revenue) by early next decade: earn customers for life by delivering great products to our
customers, leading the industry in quality and safety and improving the customer ownership experience; lead in technology and innovation, including
OnStar 4G LTE and connected car, alternative
21