General Motors 2015 Annual Report Download - page 73
Download and view the complete annual report
Please find page 73 of the 2015 General Motors annual report below. You can navigate through the pages in the report by either clicking on the pages listed below, or by using the keyword search tool below to find specific information within the annual report.-
 1
1 -
2
-
3
-
4
-
5
-
6
-
7
-
8
-
9
-
10
-
11
-
12
-
13
-
14
-
15
-
16
-
17
-
18
-
19
-
20
-
21
-
22
-
23
-
24
-
25
-
26
-
27
-
28
-
29
-
30
-
31
-
32
-
33
-
34
-
35
-
36
-
37
-
38
-
39
-
40
-
41
-
42
-
43
-
44
-
45
-
46
-
47
-
48
-
49
-
50
-
51
-
52
-
53
-
54
-
55
-
56
-
57
-
58
-
59
-
60
-
61
-
62
-
 63
63 -
 64
64 -
 65
65 -
 66
66 -
 67
67 -
 68
68 -
 69
69 -
 70
70 -
 71
71 -
 72
72 -
 73
73 -
 74
74 -
 75
75 -
 76
76 -
 77
77 -
 78
78 -
 79
79 -
 80
80 -
 81
81 -
 82
82 -
 83
83 -
84
-
85
-
86
-
87
-
88
-
89
-
90
-
91
-
92
-
93
-
94
-
95
-
96
-
97
-
98
-
99
-
100
-
101
-
102
-
103
-
104
-
105
-
106
-
107
-
108
-
109
-
110
-
111
-
112
-
113
-
114
-
115
-
116
-
117
-
118
-
119
-
120
-
121
-
122
-
123
-
124
-
125
-
126
-
127
-
128
-
129
-
130
-
131
-
132
-
133
-
134
-
135
-
136
-
137
-
138
-
139
-
140
-
141
-
142
-
143
-
144
-
145
-
146
-
147
-
148
-
149
-
150
-
151
-
152
-
153
-
154
-
155
-
156
-
157
-
158
-
159
-
160
-
161
-
162
 |
 |
Table of Contents
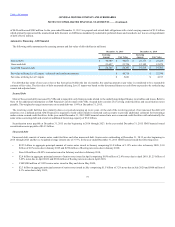
Accounts and notes receivable, net $ 721
$ 706
Accounts payable $ 179
$ 205
Undistributed earnings $ 2,158
$ 2,011
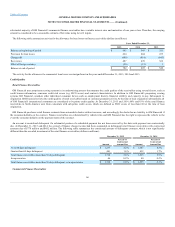
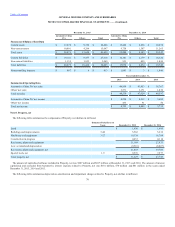
The following table summarizes the carrying amount of investments in nonconsolidated affiliates (dollars in millions):
Automotive China JVs $ 7,997
$ 8,140
Other investments 1,204
210
Total equity in net assets of nonconsolidated affiliates $ 9,201
$ 8,350
At December 31, 2015 and 2014 the carrying amount of our investments in certain joint ventures exceeded our share of the underlying net assets by $4.3
billion and $3.9 billion primarily related to goodwill from the application of fresh-start reporting and purchase of additional interests in nonconsolidated
affiliates.
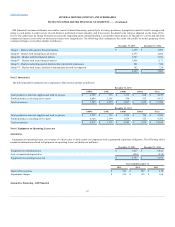
The following table summarizes our direct ownership interests in Automotive China JVs at December 31, 2015 and 2014:
SAIC General Motors Corp., Ltd. (SGM) 50%
SAIC GM (Shenyang) Norsom Motors Co., Ltd. (SGM Norsom) 25%
SAIC GM Dong Yue Motors Co., Ltd. (SGM DY) 25%
SAIC GM Dong Yue Powertrain Co., Ltd. (SGM DYPT) 25%
SAIC GM Wuling Automobile Co., Ltd. 44%
FAW-GM Light Duty Commercial Vehicle Co., Ltd. 50%
Pan Asia Technical Automotive Center Co., Ltd. 50%
Shanghai OnStar Telematics Co., Ltd. (Shanghai OnStar) 40%
Shanghai Chengxin Used Car Operation and Management Co., Ltd. (Shanghai Chengxin Used Car) 33%
SAIC General Motors Sales Co., Ltd. (SGMS) 49%
SGM is a joint venture established by Shanghai Automotive Industry Corporation (SAIC) (50%) and us (50%). SGM has interests in three other joint
ventures in China: SGM Norsom, SGM DY and SGM DYPT. These three joint ventures are jointly held by SGM (50%), SAIC (25%) and us (25%). These four
joint ventures are engaged in the production, import and sale of a comprehensive range of products under the Buick, Chevrolet and Cadillac brands. SGM
also has interests in Shanghai OnStar (20%), Shanghai Chengxin Used Car (33%) and SAIC-GMAC (20%).
The following tables present summarized financial data for nonconsolidated affiliates (dollars in millions):
69