General Motors 2015 Annual Report Download - page 72
Download and view the complete annual report
Please find page 72 of the 2015 General Motors annual report below. You can navigate through the pages in the report by either clicking on the pages listed below, or by using the keyword search tool below to find specific information within the annual report.-
 1
1 -
2
-
3
-
4
-
5
-
6
-
7
-
8
-
9
-
10
-
11
-
12
-
13
-
14
-
15
-
16
-
17
-
18
-
19
-
20
-
21
-
22
-
23
-
24
-
25
-
26
-
27
-
28
-
29
-
30
-
31
-
32
-
33
-
34
-
35
-
36
-
37
-
38
-
39
-
40
-
41
-
42
-
43
-
44
-
45
-
46
-
47
-
48
-
49
-
50
-
51
-
52
-
53
-
54
-
55
-
56
-
57
-
58
-
59
-
60
-
61
-
 62
62 -
 63
63 -
 64
64 -
 65
65 -
 66
66 -
 67
67 -
 68
68 -
 69
69 -
 70
70 -
 71
71 -
 72
72 -
 73
73 -
 74
74 -
 75
75 -
 76
76 -
 77
77 -
 78
78 -
 79
79 -
 80
80 -
 81
81 -
 82
82 -
83
-
84
-
85
-
86
-
87
-
88
-
89
-
90
-
91
-
92
-
93
-
94
-
95
-
96
-
97
-
98
-
99
-
100
-
101
-
102
-
103
-
104
-
105
-
106
-
107
-
108
-
109
-
110
-
111
-
112
-
113
-
114
-
115
-
116
-
117
-
118
-
119
-
120
-
121
-
122
-
123
-
124
-
125
-
126
-
127
-
128
-
129
-
130
-
131
-
132
-
133
-
134
-
135
-
136
-
137
-
138
-
139
-
140
-
141
-
142
-
143
-
144
-
145
-
146
-
147
-
148
-
149
-
150
-
151
-
152
-
153
-
154
-
155
-
156
-
157
-
158
-
159
-
160
-
161
-
162
 |
 |

Table of Contents
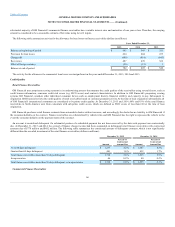
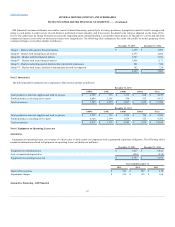
GM Financial originates leases to retail customers that are recorded as operating leases. The following table summarizes GM Financial equipment on
operating leases, net (dollars in millions):
GM Financial equipment on operating leases $ 23,005
$ 8,268
Less: accumulated depreciation (2,833)
(1,208)
GM Financial equipment on operating leases, net $ 20,172
$ 7,060
Depreciation expense related to GM Financial equipment on operating leases, net was $2.3 billion, $868 million and $450 million in the years ended
December 31, 2015, 2014 and 2013.
The following table summarizes minimum rental payments due to GM Financial as lessor under operating leases (dollars in millions):
Minimum rental receipts under operating leases $ 3,359 $ 2,830 $ 1,494 $ 169 $ 4
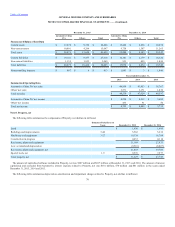
Nonconsolidated affiliates are entities in which an equity ownership interest is maintained and for which the equity method of accounting is used due to
the ability to exert significant influence over decisions relating to their operating and financial affairs. Our nonconsolidated affiliates are involved in various
aspects of the development, production and marketing of cars, trucks and automobile parts. We enter into transactions with certain nonconsolidated affiliates
to purchase and sell component parts and vehicles.
Revenue and expenses of our joint ventures are not consolidated into our financial statements; rather, our proportionate share of the earnings of each joint
venture is reflected as Equity income. The following table summarizes information regarding Equity income (dollars in millions):
Automotive China JVs $ 2,057
$ 2,066
$ 1,763
Other joint ventures 137
28
47
Total equity income $ 2,194
$ 2,094
$ 1,810
On January 2, 2015 GM Financial completed its acquisition of Ally Financial's 40% equity interest in SAIC-GMAC in China. The aggregate purchase price
was $1.0 billion. Also on January 2, 2015 GM Financial sold a 5% equity interest in SAIC-GMAC to Shanghai Automotive Group Finance Company Ltd.
(SAICFC), a current shareholder of SAIC-GMAC, for proceeds of $125 million. As a result of these transactions GM Financial now owns 35%, SAICFC owns
45% and, in the aggregate, GM indirectly owns 45% of SAIC-GMAC. GM Financial's share of earnings of SAIC-GMAC is included in the Equity income of
Other joint ventures in the table above. The pro forma effect on earnings had this acquisition occurred on January 1, 2014 was not significant.
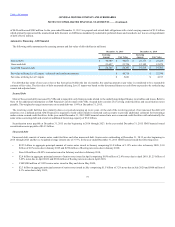
The following tables summarize transactions with and balances related to our nonconsolidated affiliates (dollars in millions):
Automotive sales and revenue $ 1,764
$ 2,762
$ 2,724
Automotive purchases, net $ 93
$ 311
$ 724
Dividends received $ 2,047
$ 1,793
$ 1,719
Operating cash flows $ 3,782
$ 4,321
$ 3,607
68