General Motors 2015 Annual Report Download - page 40
Download and view the complete annual report
Please find page 40 of the 2015 General Motors annual report below. You can navigate through the pages in the report by either clicking on the pages listed below, or by using the keyword search tool below to find specific information within the annual report.-
 1
1 -
2
-
3
-
4
-
5
-
6
-
7
-
8
-
9
-
10
-
11
-
12
-
13
-
14
-
15
-
16
-
17
-
18
-
19
-
20
-
21
-
22
-
23
-
24
-
25
-
26
-
27
-
28
-
29
-
 30
30 -
 31
31 -
 32
32 -
 33
33 -
 34
34 -
 35
35 -
 36
36 -
 37
37 -
 38
38 -
 39
39 -
 40
40 -
 41
41 -
 42
42 -
 43
43 -
 44
44 -
 45
45 -
 46
46 -
 47
47 -
 48
48 -
 49
49 -
 50
50 -
51
-
52
-
53
-
54
-
55
-
56
-
57
-
58
-
59
-
60
-
61
-
62
-
63
-
64
-
65
-
66
-
67
-
68
-
69
-
70
-
71
-
72
-
73
-
74
-
75
-
76
-
77
-
78
-
79
-
80
-
81
-
82
-
83
-
84
-
85
-
86
-
87
-
88
-
89
-
90
-
91
-
92
-
93
-
94
-
95
-
96
-
97
-
98
-
99
-
100
-
101
-
102
-
103
-
104
-
105
-
106
-
107
-
108
-
109
-
110
-
111
-
112
-
113
-
114
-
115
-
116
-
117
-
118
-
119
-
120
-
121
-
122
-
123
-
124
-
125
-
126
-
127
-
128
-
129
-
130
-
131
-
132
-
133
-
134
-
135
-
136
-
137
-
138
-
139
-
140
-
141
-
142
-
143
-
144
-
145
-
146
-
147
-
148
-
149
-
150
-
151
-
152
-
153
-
154
-
155
-
156
-
157
-
158
-
159
-
160
-
161
-
162
 |
 |

Table of Contents
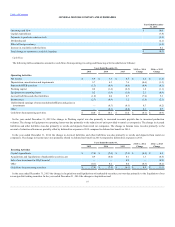
Operating cash flow $ 10.0
Capital expenditures (7.8)
Payments to purchase common stock (3.5)
Dividends paid (2.2)
Effect of foreign currency (1.4)
Increase in available credit facilities 0.2
Total change in automotive available liquidity $ (4.7)
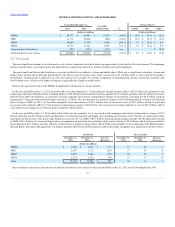
Cash Flow
The following tables summarize automotive cash flows from operating, investing and financing activities (dollars in billions):
Net income $ 8.9
$ 3.5
$ 4.7
$ 5.4
$ (1.2)
Depreciation, amortization and impairments 5.7
6.3
7.6
(0.6)
(1.3)
Pension & OPEB activities (1.3)
(0.9)
(0.8)
(0.4)
(0.1)
Working capital 0.2
(1.6)
(0.5)
1.8
(1.1)
Equipment on operating leases 0.2
(1.9)
(1.0)
2.1
(0.9)
Accrued liabilities and other liabilities (1.0)
6.0
0.7
(7.0)
5.3
Income taxes (2.7)
(0.9)
1.2
(1.8)
(2.1)
Undistributed earnings of nonconsolidated affiliates and gains on
investments —
(0.3)
(0.1)
0.3
(0.2)
Other —
(0.1)
(0.8)
0.1
0.7
Cash flows from operating activities $ 10.0
$ 10.1
$ 11.0
$ (0.1)
$ (0.9)
In the year ended December 31, 2015 the change in Working capital was due primarily to increased accounts payable due to increased production
volumes. The change in Equipment on operating leases was due primarily to the reduction of units provided to rental car companies. The change in Accrued
liabilities and other liabilities was due primarily to recalls and deposits from rental car companies. The change in Income taxes was due primarily to the
reversal of valuation allowances, partially offset by deferred tax expense in 2015 compared to deferred tax benefit in 2014.
In the year ended December 31, 2014 the change in Accrued liabilities and other liabilities was due primarily to recalls and deposits from rental car
companies. The change in Income taxes was primarily related to deferred tax benefit in 2014 compared to deferred tax expense in 2013.
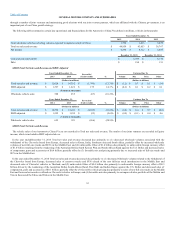
Capital expenditures $ (7.8)
$ (7.0)
$ (7.5)
$ (0.8)
$ 0.5
Acquisitions and liquidations of marketable securities, net 0.9
(0.4)
0.1
1.3
(0.5)
Sale of our investment in Ally Financial —
—
0.9
—
(0.9)
Other (0.1)
0.2
0.4
(0.3)
(0.2)
Cash flows from investing activities $ (7.0)
$ (7.2)
$ (6.1)
$ 0.2
$ (1.1)
In the year ended December 31, 2015 the change in Acquisitions and liquidations of marketable securities, net was due primarily to the liquidation of our
sovereign debt trading securities. In the year ended December 31, 2014 the change in Acquisitions and
37