General Motors 2015 Annual Report Download - page 50
Download and view the complete annual report
Please find page 50 of the 2015 General Motors annual report below. You can navigate through the pages in the report by either clicking on the pages listed below, or by using the keyword search tool below to find specific information within the annual report.-
 1
1 -
2
-
3
-
4
-
5
-
6
-
7
-
8
-
9
-
10
-
11
-
12
-
13
-
14
-
15
-
16
-
17
-
18
-
19
-
20
-
21
-
22
-
23
-
24
-
25
-
26
-
27
-
28
-
29
-
30
-
31
-
32
-
33
-
34
-
35
-
36
-
37
-
38
-
39
-
 40
40 -
 41
41 -
 42
42 -
 43
43 -
 44
44 -
 45
45 -
 46
46 -
 47
47 -
 48
48 -
 49
49 -
 50
50 -
 51
51 -
 52
52 -
 53
53 -
 54
54 -
 55
55 -
 56
56 -
 57
57 -
 58
58 -
 59
59 -
 60
60 -
61
-
62
-
63
-
64
-
65
-
66
-
67
-
68
-
69
-
70
-
71
-
72
-
73
-
74
-
75
-
76
-
77
-
78
-
79
-
80
-
81
-
82
-
83
-
84
-
85
-
86
-
87
-
88
-
89
-
90
-
91
-
92
-
93
-
94
-
95
-
96
-
97
-
98
-
99
-
100
-
101
-
102
-
103
-
104
-
105
-
106
-
107
-
108
-
109
-
110
-
111
-
112
-
113
-
114
-
115
-
116
-
117
-
118
-
119
-
120
-
121
-
122
-
123
-
124
-
125
-
126
-
127
-
128
-
129
-
130
-
131
-
132
-
133
-
134
-
135
-
136
-
137
-
138
-
139
-
140
-
141
-
142
-
143
-
144
-
145
-
146
-
147
-
148
-
149
-
150
-
151
-
152
-
153
-
154
-
155
-
156
-
157
-
158
-
159
-
160
-
161
-
162
 |
 |
Table of Contents
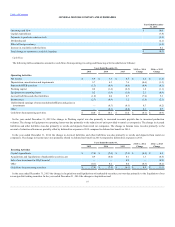
At December 31, 2015 and 2014 we had marketable securities of $7.6 billion and $8.0 billion classified as available-for-sale and $0.6 billion and $1.3
billion classified as trading. The potential decrease in fair value from a 50 basis point increase in interest rates would have been insignificant at December 31,
2015 and 2014.
Fluctuations in market interest rates can affect GM Financial's gross interest rate spread, which is the difference between interest earned on finance
receivables and interest paid on debt. Typically retail finance receivables purchased by GM Financial bear fixed interest rates and are funded by variable or
fixed rate debt. Commercial finance receivables originated by GM Financial bear variable interest rates and are funded by variable rate debt. The variable rate
debt is subject to adjustments to reflect prevailing market interest rates. To help mitigate interest rate risk or mismatched funding, GM Financial may employ
hedging strategies to lock in the interest rate spread.
Fixed interest rate receivables purchased by GM Financial are pledged to secure borrowings under its credit facilities. Amounts borrowed under these credit
facilities bear interest at variable rates that are subject to frequent adjustments to reflect prevailing market interest rates. To protect the interest rate spread
within each credit facility, GM Financial is contractually required to enter into interest rate cap agreements in connection with borrowings under its credit
facilities.
In GM Financial's securitization transactions it can transfer fixed rate finance receivables to securitization trusts that, in turn, sell either fixed rate or
floating rate securities to investors. Derivative financial instruments, such as interest rate swaps and caps, are used to manage the gross interest rate spread on
the floating rate transactions.
GM Financial had interest rate swaps and caps in asset positions with notional amounts of $10.4 billion and $3.8 billion and interest rate swaps and caps in
liability positions with notional amounts of $13.9 billion and $7.4 billion at December 31, 2015 and 2014. The fair value of these derivative financial
instruments was insignificant.
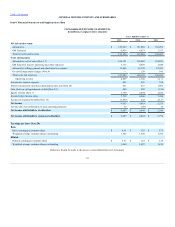
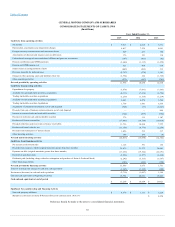
The following table summarizes GM Financial's interest rate sensitive assets and liabilities, excluding derivatives, by year of expected maturity and the fair
value of those assets and liabilities at December 31, 2015 (dollars in millions):
Retail finance receivables
Principal amounts $ 11,415
$ 8,204
$ 5,136
$ 2,715
$ 1,268
$ 523
$ 28,545
Weighted-average annual percentage rate 9.03%
9.08%
9.09%
9.17%
9.16%
9.37%
Commercial finance receivables
Principal amounts $ 7,900
$ 106
$ 103
$ 101
$ 72
$ 98
$ 8,162
Weighted-average annual percentage rate 2.85%
4.45%
4.32%
4.33%
4.39%
4.24%
Secured Debt:
Credit facilities
Principal amounts $ 5,563
$ 1,286
$ 592
$ 95
$ 11
$ —
$ 7,494
Weighted-average interest rate 2.50%
3.85%
3.92%
5.53%
4.86%
—%
Securitization notes
Principal amounts $ 8,887
$ 7,882
$ 5,096
$ 1,025
$ 306
$ —
$ 23,177
Weighted-average interest rate 1.80%
1.84%
2.17%
2.60%
2.59%
—%
Unsecured Debt:
Senior notes
Principal amounts $ 1,000
$ 2,738
$ 3,106
$ 3,093
$ 4,110
$ 5,050
$ 19,045
Weighted-average interest rate 2.75%
3.57%
3.08%
2.93%
3.22%
4.04%
Credit facilities and other unsecured debt
Principal amounts $ 3,343
$ 916
$ 353
$ 72
$ —
$ —
$ 4,681
Weighted-average interest rate 7.89%
8.31%
2.74%
5.19%
—%
—%
47