General Motors 2015 Annual Report Download - page 95
Download and view the complete annual report
Please find page 95 of the 2015 General Motors annual report below. You can navigate through the pages in the report by either clicking on the pages listed below, or by using the keyword search tool below to find specific information within the annual report.-
 1
1 -
2
-
3
-
4
-
5
-
6
-
7
-
8
-
9
-
10
-
11
-
12
-
13
-
14
-
15
-
16
-
17
-
18
-
19
-
20
-
21
-
22
-
23
-
24
-
25
-
26
-
27
-
28
-
29
-
30
-
31
-
32
-
33
-
34
-
35
-
36
-
37
-
38
-
39
-
40
-
41
-
42
-
43
-
44
-
45
-
46
-
47
-
48
-
49
-
50
-
51
-
52
-
53
-
54
-
55
-
56
-
57
-
58
-
59
-
60
-
61
-
62
-
63
-
64
-
65
-
66
-
67
-
68
-
69
-
70
-
71
-
72
-
73
-
74
-
75
-
76
-
77
-
78
-
79
-
80
-
81
-
82
-
83
-
84
-
 85
85 -
 86
86 -
 87
87 -
 88
88 -
 89
89 -
 90
90 -
 91
91 -
 92
92 -
 93
93 -
 94
94 -
 95
95 -
 96
96 -
 97
97 -
 98
98 -
 99
99 -
 100
100 -
 101
101 -
 102
102 -
 103
103 -
 104
104 -
 105
105 -
106
-
107
-
108
-
109
-
110
-
111
-
112
-
113
-
114
-
115
-
116
-
117
-
118
-
119
-
120
-
121
-
122
-
123
-
124
-
125
-
126
-
127
-
128
-
129
-
130
-
131
-
132
-
133
-
134
-
135
-
136
-
137
-
138
-
139
-
140
-
141
-
142
-
143
-
144
-
145
-
146
-
147
-
148
-
149
-
150
-
151
-
152
-
153
-
154
-
155
-
156
-
157
-
158
-
159
-
160
-
161
-
162
 |
 |

Table of Contents
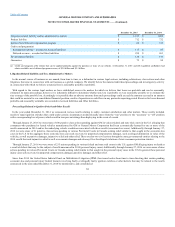
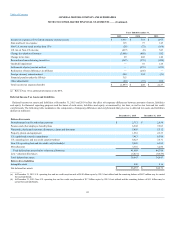
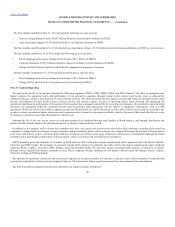
Rental expense under operating leases was $357 million, $444 million and $477 million in the years ended December 31, 2015, 2014 and 2013.
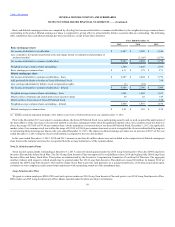
The following table summarizes income before income taxes and equity income (dollars in millions):
U.S. income $ 5,594
$ 1,683
$ 4,880
Non-U.S. income (loss) (70)
469
768
Income before income taxes and equity income $ 5,524
$ 2,152
$ 5,648
The following table summarizes Income tax expense (benefit) (dollars in millions):
U.S. federal $ 5
$ (23)
$ (34)
U.S. state and local (5)
154
88
Non-U.S. 860
671
512
Total current income tax expense 860
802
566
U.S. federal 1,001
(581)
1,049
U.S. state and local 199
(60)
137
Non-U.S. (3,957)
67
375
Total deferred income tax expense (benefit) (2,757)
(574)
1,561
Total income tax expense (benefit) $ (1,897)
$ 228
$ 2,127
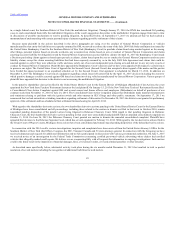
Provisions are made for estimated U.S. and non-U.S. income taxes, less available tax credits and deductions, which may be incurred on the remittance of
our basis differences in investments in foreign subsidiaries and corporate joint ventures not deemed to be indefinitely reinvested. Taxes have not been
provided on basis differences in investments primarily as a result of earnings in foreign subsidiaries and corporate joint ventures which are deemed
indefinitely reinvested of $2.8 billion and $3.0 billion at December 31, 2015 and 2014. Additional basis differences related to investments in
nonconsolidated Automotive China JVs exist of $4.1 billion at December 31, 2015 and 2014 primarily related to fresh-start reporting. Quantification of the
deferred tax liability, if any, associated with indefinitely reinvested basis differences is not practicable. The Non-U.S. deferred income tax benefit in the year
ended December 31, 2015 relates primarily to the release of valuation allowances in GME.
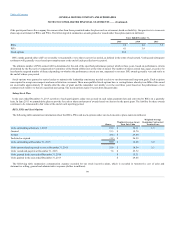
The following table summarizes a reconciliation of Income tax expense (benefit) compared with the amounts at the U.S. federal statutory income tax rate
(dollars in millions):
91