General Motors 2015 Annual Report Download - page 35
Download and view the complete annual report
Please find page 35 of the 2015 General Motors annual report below. You can navigate through the pages in the report by either clicking on the pages listed below, or by using the keyword search tool below to find specific information within the annual report.-
 1
1 -
2
-
3
-
4
-
5
-
6
-
7
-
8
-
9
-
10
-
11
-
12
-
13
-
14
-
15
-
16
-
17
-
18
-
19
-
20
-
21
-
22
-
23
-
24
-
 25
25 -
 26
26 -
 27
27 -
 28
28 -
 29
29 -
 30
30 -
 31
31 -
 32
32 -
 33
33 -
 34
34 -
 35
35 -
 36
36 -
 37
37 -
 38
38 -
 39
39 -
 40
40 -
 41
41 -
 42
42 -
 43
43 -
 44
44 -
 45
45 -
46
-
47
-
48
-
49
-
50
-
51
-
52
-
53
-
54
-
55
-
56
-
57
-
58
-
59
-
60
-
61
-
62
-
63
-
64
-
65
-
66
-
67
-
68
-
69
-
70
-
71
-
72
-
73
-
74
-
75
-
76
-
77
-
78
-
79
-
80
-
81
-
82
-
83
-
84
-
85
-
86
-
87
-
88
-
89
-
90
-
91
-
92
-
93
-
94
-
95
-
96
-
97
-
98
-
99
-
100
-
101
-
102
-
103
-
104
-
105
-
106
-
107
-
108
-
109
-
110
-
111
-
112
-
113
-
114
-
115
-
116
-
117
-
118
-
119
-
120
-
121
-
122
-
123
-
124
-
125
-
126
-
127
-
128
-
129
-
130
-
131
-
132
-
133
-
134
-
135
-
136
-
137
-
138
-
139
-
140
-
141
-
142
-
143
-
144
-
145
-
146
-
147
-
148
-
149
-
150
-
151
-
152
-
153
-
154
-
155
-
156
-
157
-
158
-
159
-
160
-
161
-
162
 |
 |
Table of Contents
through a number of joint ventures and maintaining good relations with our joint venture partners, which are affiliated with the Chinese government, is an
important part of our China growth strategy.
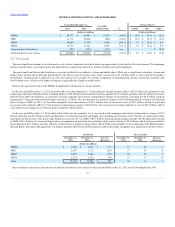
The following tables summarize certain key operational and financial data for the Automotive China JVs (dollars in millions, vehicles in thousands):
Total wholesale vehicles including vehicles exported to markets outside of China 3,794
3,613
3,239
Total net sales and revenue $ 44,959
$ 43,853
$ 38,767
Net income $ 4,290
$ 4,312
$ 3,685
Cash and cash equivalents $ 5,939
$ 6,176
Debt $ 184
$ 151
Total net sales and revenue $ 12,626
$ 14,392
$ (1,766)
(12.3)%
$ (1.2)
$ 0.7
$ 0.1
$ (1.4)
EBIT-adjusted $ 1,397
$ 1,222
$ 175
14.3 %
$ (0.2)
$ 0.1
$ 0.2
$ 0.1
Wholesale vehicle sales 588
655
(67)
(10.2)%
Total net sales and revenue $ 14,392
$ 18,411
$ (4,019)
(21.8)%
$ (4.6)
$ 0.4
$ 0.7
$ (0.4)
EBIT-adjusted $ 1,222
$ 1,255
$ (33)
(2.6)%
$ (0.9)
$ (0.1)
$ 0.4
$ 0.6
Wholesale vehicle sales 655
921
(266)
(28.9)%
The vehicle sales of our Automotive China JVs are not recorded in Total net sales and revenue. The results of our joint ventures are recorded in Equity
income, which is included in EBIT-adjusted above.
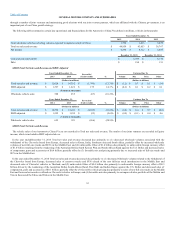
In the year ended December 31, 2015 Total net sales and revenue decreased due primarily to: (1) decreased wholesale volumes associated with the
withdrawal of the Chevrolet brand from Europe, decreased sales in Korea, India, Southeast Asia and South Africa, partially offset by increased wholesale
volumes of new full-size trucks and SUVs in the Middle East; and (2) unfavorable Other of $1.4 billion due primarily to unfavorable foreign currency effect
of $1.0 billion resulting from the weakening of the Australian Dollar, South Korean Won and South African Rand against the U.S. Dollar and decreased sales
of components, parts and accessories of $0.4 billion; partially offset by (3) favorable mix and pricing primarily due to increased sales of full-size trucks and
SUVs in the Middle East.
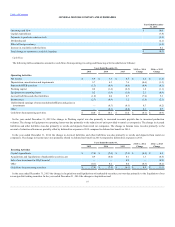
In the year ended December 31, 2014 Total net sales and revenue decreased due primarily to: (1) decreased wholesale volumes related to the withdrawal of
the Chevrolet brand from Europe, decreased sales of carryover trucks and SUVs ahead of the new full-size truck introduction in the Middle East and
decreased sales of Chevrolet vehicles in Thailand; and (2) unfavorable Other of $0.4 billion due primarily to unfavorable foreign currency effect of $0.3
billion driven by the weakening of the Australian Dollar, South African Rand, Thai Baht and Indian Rupee against the U.S. Dollar and decreased sales of
components, parts and accessories of $0.1 billion; partially offset by (3) favorable vehicle pricing due primarily to sales of new full-size trucks in the Middle
East and lower sales incentives offered on Chevrolet vehicles in Europe; and (4) favorable mix due primarily to an improved sales portfolio of the Malibu and
Trax in Korea and the Tahoe and Yukon in the Middle East.
32