General Motors 2015 Annual Report Download - page 6
Download and view the complete annual report
Please find page 6 of the 2015 General Motors annual report below. You can navigate through the pages in the report by either clicking on the pages listed below, or by using the keyword search tool below to find specific information within the annual report.-
 1
1 -
 2
2 -
 3
3 -
 4
4 -
 5
5 -
 6
6 -
 7
7 -
 8
8 -
 9
9 -
 10
10 -
 11
11 -
 12
12 -
 13
13 -
 14
14 -
 15
15 -
 16
16 -
 17
17 -
18
-
19
-
20
-
21
-
22
-
23
-
24
-
25
-
26
-
27
-
28
-
29
-
30
-
31
-
32
-
33
-
34
-
35
-
36
-
37
-
38
-
39
-
40
-
41
-
42
-
43
-
44
-
45
-
46
-
47
-
48
-
49
-
50
-
51
-
52
-
53
-
54
-
55
-
56
-
57
-
58
-
59
-
60
-
61
-
62
-
63
-
64
-
65
-
66
-
67
-
68
-
69
-
70
-
71
-
72
-
73
-
74
-
75
-
76
-
77
-
78
-
79
-
80
-
81
-
82
-
83
-
84
-
85
-
86
-
87
-
88
-
89
-
90
-
91
-
92
-
93
-
94
-
95
-
96
-
97
-
98
-
99
-
100
-
101
-
102
-
103
-
104
-
105
-
106
-
107
-
108
-
109
-
110
-
111
-
112
-
113
-
114
-
115
-
116
-
117
-
118
-
119
-
120
-
121
-
122
-
123
-
124
-
125
-
126
-
127
-
128
-
129
-
130
-
131
-
132
-
133
-
134
-
135
-
136
-
137
-
138
-
139
-
140
-
141
-
142
-
143
-
144
-
145
-
146
-
147
-
148
-
149
-
150
-
151
-
152
-
153
-
154
-
155
-
156
-
157
-
158
-
159
-
160
-
161
-
162
 |
 |

Table of Contents
__________
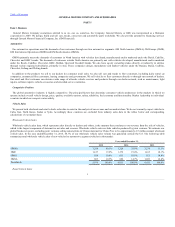
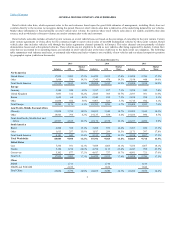
(a) Our China sales include the Automotive China JVs SAIC General Motors Sales Co., Ltd. (SGMS), SAIC-GM-Wuling Automobile Co., Ltd. (SGMW) and FAW-GM Light
Duty Commercial Vehicle Co., Ltd. (FAW-GM). End customer data is not readily available for the industry; therefore, wholesale volumes were used for Industry, GM and
Market Share. Our retail sales in China were 3,613; 3,435 and 3,082 in the years ended December 31, 2015, 2014 and 2013.
In the year ended December 31, 2015 we estimate we had the largest market share in North America and South America, the number two market share in the
Asia/Pacific, Middle East and Africa region, which included the largest market share in China, and the number seven market share in Europe. In the year
ended December 31, 2015 the Asia/Pacific, Middle East and Africa region was our largest region by retail vehicle sales volume and represented 45.4% of our
global retail vehicle sales.
Our retail vehicle sales volumes in the year ended December 31, 2015 grew at a slightly slower pace than the overall industry, resulting in a 0.2 percentage
point industry share decline. Our market share decreased due primarily to the change of our business model in Russia, our vehicle price increases in Brazil
and our planned reduction of fleet sales in the U.S., (refer to the "Overview" section of Management's Discussion and Analysis of Financial Condition and
Results of Operations (MD&A) for detail), partially offset by our market share increase in China driven by strong performance of existing products and
successful new launches including new sport utility vehicles(SUVs), Cadillac vehicles and multipurpose vehicles. Our retail vehicle sales volumes in the
year ended December 31, 2014 grew at a slightly slower pace than the overall industry, resulting in a 0.1 percentage point industry share decline. Our market
share decreased due primarily to the withdrawal of the Chevrolet brand from Europe and economic conditions and competitive environment in Brazil,
partially offset by our market share increase in China driven by improved performance of existing products and successful launches of new vehicles.
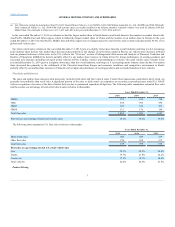
Fleet Sales and Deliveries
The sales and market share data provided previously includes both retail and fleet vehicle sales. Certain fleet transactions, particularly daily rental, are
generally less profitable than retail sales. A significant portion of the sales to daily rental car companies are recorded as operating leases under U.S. GAAP
with no recognition of revenue at the date of initial delivery due to guaranteed repurchase obligations. The following table summarizes estimated fleet sales
and those sales as a percentage of total retail vehicle sales (vehicles in thousands):
GMNA 795
814
758
GME 544
505
490
GMIO 345
414
415
GMSA 121
176
184
Total fleet sales 1,805
1,909
1,847
Fleet sales as a percentage of total retail vehicle sales 18.1%
19.2%
19.0%
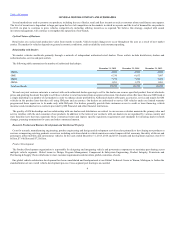
The following table summarizes U.S. fleet sales (vehicles in thousands):
Daily rental sales 400
449
439
Other fleet sales 278
255
217
Total fleet sales 678
704
656
Cars 29.3%
29.5%
26.4%
Trucks 19.7%
21.8%
24.2%
Crossovers 17.5%
19.1%
18.6%
Total vehicles 22.0%
24.0%
23.6%
3