General Motors 2015 Annual Report Download - page 38
Download and view the complete annual report
Please find page 38 of the 2015 General Motors annual report below. You can navigate through the pages in the report by either clicking on the pages listed below, or by using the keyword search tool below to find specific information within the annual report.-
 1
1 -
2
-
3
-
4
-
5
-
6
-
7
-
8
-
9
-
10
-
11
-
12
-
13
-
14
-
15
-
16
-
17
-
18
-
19
-
20
-
21
-
22
-
23
-
24
-
25
-
26
-
27
-
 28
28 -
 29
29 -
 30
30 -
 31
31 -
 32
32 -
 33
33 -
 34
34 -
 35
35 -
 36
36 -
 37
37 -
 38
38 -
 39
39 -
 40
40 -
 41
41 -
 42
42 -
 43
43 -
 44
44 -
 45
45 -
 46
46 -
 47
47 -
 48
48 -
49
-
50
-
51
-
52
-
53
-
54
-
55
-
56
-
57
-
58
-
59
-
60
-
61
-
62
-
63
-
64
-
65
-
66
-
67
-
68
-
69
-
70
-
71
-
72
-
73
-
74
-
75
-
76
-
77
-
78
-
79
-
80
-
81
-
82
-
83
-
84
-
85
-
86
-
87
-
88
-
89
-
90
-
91
-
92
-
93
-
94
-
95
-
96
-
97
-
98
-
99
-
100
-
101
-
102
-
103
-
104
-
105
-
106
-
107
-
108
-
109
-
110
-
111
-
112
-
113
-
114
-
115
-
116
-
117
-
118
-
119
-
120
-
121
-
122
-
123
-
124
-
125
-
126
-
127
-
128
-
129
-
130
-
131
-
132
-
133
-
134
-
135
-
136
-
137
-
138
-
139
-
140
-
141
-
142
-
143
-
144
-
145
-
146
-
147
-
148
-
149
-
150
-
151
-
152
-
153
-
154
-
155
-
156
-
157
-
158
-
159
-
160
-
161
-
162
 |
 |

Table of Contents
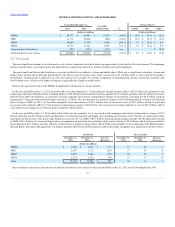
In the year ended December 31, 2015 Total revenue increased due primarily to: (1) increased leased vehicle income of $1.7 billion due to a larger lease
portfolio; partially offset by (2) net decrease in finance charge income and other income of $0.1 billion which consists of a decrease of $0.3 billion outside of
North America, partially offset by an increase of $0.2 billion in North America.
In the year ended December 31, 2014 Total revenue increased due primarily to: (1) increased finance charge income of $0.9 billion due to the acquisition
of Ally Financial international operations; and (2) increased leased vehicle income of $0.5 billion due to a larger lease portfolio.
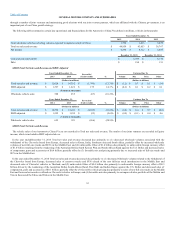
In the year ended December 31, 2015 Income before income taxes-adjusted remained flat due primarily to: (1) increased revenue of $1.6 billion; and (2)
increased equity income of $0.1 billion from SAIC-GMAC; offset by (3) increased leased vehicles expenses of $1.4 billion due to a larger lease portfolio; (4)
net increase in interest expense of $0.2 billion which consists of an increase of $0.4 billion in North America due to an increase in average debt outstanding,
partially offset by a decrease of $0.2 billion outside of North America; and (5) net increase in operating expenses of $0.1 billion which consists of an increase
of $0.2 billion in North America, partially offset by a decrease of $0.1 billion outside of North America.
In the year ended December 31, 2014 Income before income taxes-adjusted decreased due primarily to: (1) increased interest expenses of $0.7 billion due
to higher average debt outstanding and effective rate of interest paid; (2) increased operating expenses of $0.4 billion due to the acquisition of Ally Financial
international operations; (3) increased leased vehicle expenses of $0.4 billion due to a larger lease portfolio; and (4) increased provision for loan losses of
$0.1 billion; partially offset by (5) increased revenue of $1.5 billion.
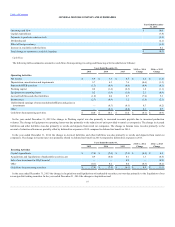
We believe that our current level of cash and cash equivalents, marketable securities and availability under our revolving credit facilities will be sufficient
to meet our liquidity needs. We expect to have substantial cash requirements going forward which we plan to fund through total available liquidity and cash
flows generated from operations. We also maintain access to the capital markets and may issue debt or equity securities from time to time, which may provide
an additional source of liquidity. Our future uses of cash, which may vary from time to time based on market conditions and other factors, are focused on three
objectives: (1) reinvest in our business; (2) maintain an investment-grade balance sheet; and (3) return cash to stockholders. Our known future material uses
of cash include, among other possible demands: (1) capital expenditures of approximately $9.0 billion as well as payments for engineering and product
development activities; (2) payments associated with previously announced vehicle recalls, the settlements of the Shareholder Class Action and the
multidistrict litigation and any other recall-related contingencies; (3) payments to service debt and other long-term obligations, including contributions to
our pension plans; (4) payments for previously announced restructuring activities; (5) dividend payments on our common stock that are declared by our
Board of Directors; and (6) payments to purchase shares of our common stock under programs authorized by our Board of Directors.
Our liquidity plans are subject to a number of risks and uncertainties, including those described in Item 1A. Risk Factors, some of which are outside of our
control. Macroeconomic conditions could limit our ability to successfully execute our business plans and therefore adversely affect our liquidity plans and
compliance with certain covenants. Refer to Note 12 to our consolidated financial statements for the discussion of our financial and operational covenants.
We continue to monitor and evaluate opportunities to strengthen our competitive position over the long term while maintaining an investment-grade
balance sheet. These actions may include opportunistic payments to reduce our long-term obligations as well as the possibility of acquisitions, dispositions,
investments with joint venture partners, and strategic alliances that we believe would generate significant advantages and substantially strengthen our
business. These actions may negatively impact our liquidity in the short term.
In March 2015 management announced its plan to return all available free cash flow to stockholders while maintaining an investment-grade balance sheet.
Management's capital allocation framework includes a combined cash and marketable securities balance target of $20 billion and plans to reinvest in the
business at an average target ROIC rate of 20% or more. In connection
35