General Motors 2015 Annual Report Download - page 71
Download and view the complete annual report
Please find page 71 of the 2015 General Motors annual report below. You can navigate through the pages in the report by either clicking on the pages listed below, or by using the keyword search tool below to find specific information within the annual report.-
 1
1 -
2
-
3
-
4
-
5
-
6
-
7
-
8
-
9
-
10
-
11
-
12
-
13
-
14
-
15
-
16
-
17
-
18
-
19
-
20
-
21
-
22
-
23
-
24
-
25
-
26
-
27
-
28
-
29
-
30
-
31
-
32
-
33
-
34
-
35
-
36
-
37
-
38
-
39
-
40
-
41
-
42
-
43
-
44
-
45
-
46
-
47
-
48
-
49
-
50
-
51
-
52
-
53
-
54
-
55
-
56
-
57
-
58
-
59
-
60
-
 61
61 -
 62
62 -
 63
63 -
 64
64 -
 65
65 -
 66
66 -
 67
67 -
 68
68 -
 69
69 -
 70
70 -
 71
71 -
 72
72 -
 73
73 -
 74
74 -
 75
75 -
 76
76 -
 77
77 -
 78
78 -
 79
79 -
 80
80 -
 81
81 -
82
-
83
-
84
-
85
-
86
-
87
-
88
-
89
-
90
-
91
-
92
-
93
-
94
-
95
-
96
-
97
-
98
-
99
-
100
-
101
-
102
-
103
-
104
-
105
-
106
-
107
-
108
-
109
-
110
-
111
-
112
-
113
-
114
-
115
-
116
-
117
-
118
-
119
-
120
-
121
-
122
-
123
-
124
-
125
-
126
-
127
-
128
-
129
-
130
-
131
-
132
-
133
-
134
-
135
-
136
-
137
-
138
-
139
-
140
-
141
-
142
-
143
-
144
-
145
-
146
-
147
-
148
-
149
-
150
-
151
-
152
-
153
-
154
-
155
-
156
-
157
-
158
-
159
-
160
-
161
-
162
 |
 |

Table of Contents
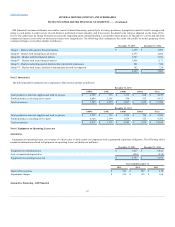
GM Financial's commercial finance receivables consist of dealer financings, primarily for inventory purchases. A proprietary model is used to assign a risk
rating to each dealer. A credit review of each dealer is performed at least annually, and if necessary, the dealer's risk rating is adjusted on the basis of the
review. The credit lines for Group VI dealers are typically suspended and no further funding is extended to these dealers. At December 31, 2015 and 2014 the
commercial finance receivables on non-accrual status were insignificant. The following table summarizes the credit risk profile by dealer grouping of the
commercial finance receivables (dollars in millions):
Group I – Dealers with superior financial metrics $ 1,298 $ 1,050
Group II – Dealers with strong financial metrics 2,573 2,022
Group III – Dealers with fair financial metrics 2,597 2,599
Group IV – Dealers with weak financial metrics 1,058 1,173
Group V – Dealers warranting special mention due to potential weaknesses 501 524
Group VI – Dealers with loans classified as substandard, doubtful or impaired 182
238
$ 8,209 $ 7,606
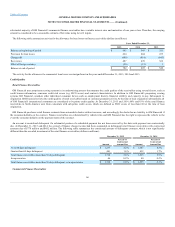
The following tables summarize the components of Inventories (dollars in millions):
Total productive material, supplies and work in process $ 2,705
$ 713
$ 1,113
$ 616
$ 5,147
Finished product, including service parts 4,884
2,166
954
613
8,617
Total inventories $ 7,589
$ 2,879
$ 2,067
$ 1,229
$ 13,764
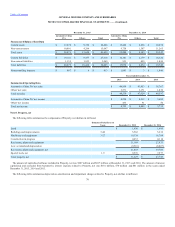
Total productive material, supplies and work in process $ 2,592
$ 778
$ 1,216
$ 794
$ 5,380
Finished product, including service parts 4,320
2,394
1,026
522
8,262
Total inventories $ 6,912
$ 3,172
$ 2,242
$ 1,316
$ 13,642
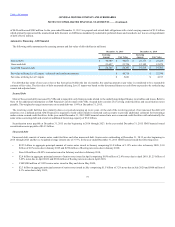
Equipment on operating leases, net consists of vehicle sales to daily rental car companies with a guaranteed repurchase obligation. The following tables
summarize information related to Equipment on operating leases, net (dollars in millions):
Equipment on operating leases $ 3,037
$ 3,822
Less: accumulated depreciation (254)
(258)
Equipment on operating leases, net $ 2,783
$ 3,564
Depreciation expense $ 341
$ 507
$ 218
Impairment charges $ 215
$ 155
$ 168
67