General Motors 2015 Annual Report Download - page 32
Download and view the complete annual report
Please find page 32 of the 2015 General Motors annual report below. You can navigate through the pages in the report by either clicking on the pages listed below, or by using the keyword search tool below to find specific information within the annual report.-
 1
1 -
2
-
3
-
4
-
5
-
6
-
7
-
8
-
9
-
10
-
11
-
12
-
13
-
14
-
15
-
16
-
17
-
18
-
19
-
20
-
21
-
 22
22 -
 23
23 -
 24
24 -
 25
25 -
 26
26 -
 27
27 -
 28
28 -
 29
29 -
 30
30 -
 31
31 -
 32
32 -
 33
33 -
 34
34 -
 35
35 -
 36
36 -
 37
37 -
 38
38 -
 39
39 -
 40
40 -
 41
41 -
 42
42 -
43
-
44
-
45
-
46
-
47
-
48
-
49
-
50
-
51
-
52
-
53
-
54
-
55
-
56
-
57
-
58
-
59
-
60
-
61
-
62
-
63
-
64
-
65
-
66
-
67
-
68
-
69
-
70
-
71
-
72
-
73
-
74
-
75
-
76
-
77
-
78
-
79
-
80
-
81
-
82
-
83
-
84
-
85
-
86
-
87
-
88
-
89
-
90
-
91
-
92
-
93
-
94
-
95
-
96
-
97
-
98
-
99
-
100
-
101
-
102
-
103
-
104
-
105
-
106
-
107
-
108
-
109
-
110
-
111
-
112
-
113
-
114
-
115
-
116
-
117
-
118
-
119
-
120
-
121
-
122
-
123
-
124
-
125
-
126
-
127
-
128
-
129
-
130
-
131
-
132
-
133
-
134
-
135
-
136
-
137
-
138
-
139
-
140
-
141
-
142
-
143
-
144
-
145
-
146
-
147
-
148
-
149
-
150
-
151
-
152
-
153
-
154
-
155
-
156
-
157
-
158
-
159
-
160
-
161
-
162
 |
 |

Table of Contents
Total net sales and revenue $ 101,199
$ 95,099
$ 6,100
6.4 %
$ 1.3
$ 1.2
$ 3.4
$ 0.3
EBIT-adjusted $ 6,603
$ 7,461
$ (858)
(11.5)%
$ 0.4
$ 0.3
$ 3.4
$ (5.0)
Wholesale vehicle sales 3,320
3,276
44
1.3 %
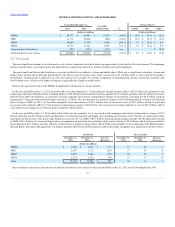
In the year ended December 31, 2015 Total net sales and revenue increased due primarily to: (1) increased net wholesale volumes associated with full-size
SUVs, mid-size pick-ups and the Chevrolet Trax, Impala and Cruze, partially offset by decreases in the Chevrolet Malibu; and (2) favorable mix due to full-
size SUVs and full-size pick-ups partially offset by an increase in rental cars sold at auction and the Chevrolet Trax; partially offset by (3) unfavorable pricing
primarily related to carryovers including passenger cars and compact SUVs; and (4) unfavorable Other of $1.2 billion due primarily to unfavorable foreign
currency effect related to the weakening of the CAD and the Mexican Peso against the U.S. dollar of $1.7 billion partially offset by increased revenue related
to OnStar of $0.2 billion.
In the year ended December 31, 2014 Total net sales and revenue increased due primarily to: (1) favorable pricing related to full-size pick-ups and full-size
SUVs; (2) increased net wholesale volumes due to full-size pick-ups, full-size SUVs, and the Chevrolet Colorado, Corvette and Malibu, partially offset by
decreases of the Chevrolet Impala, Captiva and Cruze; (3) favorable mix due to full-size pick-ups, full-size SUVs and the Chevrolet Corvette and Impala; and
(4) favorable Other of $0.3 billion due primarily to increased operating lease revenue related to daily rental vehicles sold with guaranteed repurchase
obligations and increased parts and accessories sales, partially offset by unfavorable foreign currency effect related primarily to the weakening of the CAD
and Mexican Peso against the U.S. Dollar.
The most significant factors which influence a region's profitability are industry volume and market share. While not as significant as industry volume and
market share, another factor affecting profitability is the relative mix of vehicles (cars, trucks, crossovers) sold. Variable profit is a key indicator of product
profitability. Variable profit is defined as revenue less material cost, freight, the variable component of manufacturing expense and policy, warranty and
recall-related costs. Vehicles with higher selling prices generally have higher variable profit. Trucks, crossovers and cars sold currently have a variable profit
of approximately 170%, 80% and 30% of our portfolio on a weighted-average basis.
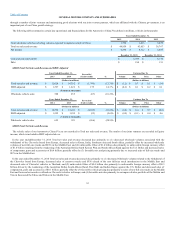
In the year ended December 31, 2015 EBIT-adjusted increased due primarily to: (1) increased net wholesale volumes; (2) favorable mix; and (3) favorable
Other of $3.0 billion including decreased material and freight costs of $2.2 billion and a decrease in recall-related charges of $1.9 billion, partially offset by
policy and warranty of $0.3 billion, engineering of $0.3 billion, General Motors of Canada Company (GM Canada) pension curtailment and restructuring
charges of $0.2 billion and advertising of $0.2 billion; partially offset by (4) unfavorable pricing.
In the year ended December 31, 2014 EBIT-adjusted decreased due primarily to: (1) unfavorable Other of $5.0 billion due primarily to an increase in recall
campaign actions and recall-related charges of $2.3 billion, increased material and freight costs including new launches of $2.8 billion and increased
engineering expense of $0.5 billion, partially offset by increased daily rental vehicles sold with guaranteed repurchase obligations and reduced advertising
expenses; partially offset by (2) favorable pricing; (3) increased net wholesale volumes; and (4) favorable mix.
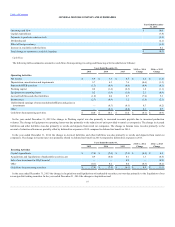
In connection with ongoing comprehensive safety reviews, engineering analysis and our overall commitment to customer satisfaction we have incurred
incremental charges for the estimated costs of parts and labor to repair vehicles and provide courtesy transportation for customers with vehicles subject to
recalls.
The following table summarizes the impact of recall-related activities including customer satisfaction campaigns, safety recalls, non-compliance recalls,
special coverage, and courtesy transportation (dollars in millions):
29