General Motors 2015 Annual Report Download - page 30
Download and view the complete annual report
Please find page 30 of the 2015 General Motors annual report below. You can navigate through the pages in the report by either clicking on the pages listed below, or by using the keyword search tool below to find specific information within the annual report.-
 1
1 -
2
-
3
-
4
-
5
-
6
-
7
-
8
-
9
-
10
-
11
-
12
-
13
-
14
-
15
-
16
-
17
-
18
-
19
-
 20
20 -
 21
21 -
 22
22 -
 23
23 -
 24
24 -
 25
25 -
 26
26 -
 27
27 -
 28
28 -
 29
29 -
 30
30 -
 31
31 -
 32
32 -
 33
33 -
 34
34 -
 35
35 -
 36
36 -
 37
37 -
 38
38 -
 39
39 -
 40
40 -
41
-
42
-
43
-
44
-
45
-
46
-
47
-
48
-
49
-
50
-
51
-
52
-
53
-
54
-
55
-
56
-
57
-
58
-
59
-
60
-
61
-
62
-
63
-
64
-
65
-
66
-
67
-
68
-
69
-
70
-
71
-
72
-
73
-
74
-
75
-
76
-
77
-
78
-
79
-
80
-
81
-
82
-
83
-
84
-
85
-
86
-
87
-
88
-
89
-
90
-
91
-
92
-
93
-
94
-
95
-
96
-
97
-
98
-
99
-
100
-
101
-
102
-
103
-
104
-
105
-
106
-
107
-
108
-
109
-
110
-
111
-
112
-
113
-
114
-
115
-
116
-
117
-
118
-
119
-
120
-
121
-
122
-
123
-
124
-
125
-
126
-
127
-
128
-
129
-
130
-
131
-
132
-
133
-
134
-
135
-
136
-
137
-
138
-
139
-
140
-
141
-
142
-
143
-
144
-
145
-
146
-
147
-
148
-
149
-
150
-
151
-
152
-
153
-
154
-
155
-
156
-
157
-
158
-
159
-
160
-
161
-
162
 |
 |

Table of Contents
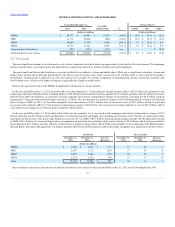
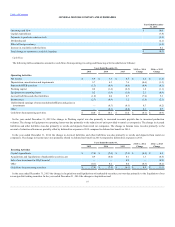
GMNA $ 89,371
$ 81,404
$ (7,967)
(9.8)%
$ (0.8)
$ (0.9)
$ (6.2)
GME 21,712
20,824
(888)
(4.3)%
$ (0.1)
$ (0.5)
$ (0.3)
GMIO 14,009
17,599
3,590
20.4 %
$ 3.7
$ (0.5)
$ 0.4
GMSA 12,736
15,221
2,485
16.3 %
$ 1.9
$ (0.2)
$ 0.8
Corporate and eliminations 254
(123)
(377)
n.m.
$ (0.4)
Total automotive cost of sales $ 138,082
$ 134,925
$ (3,157)
(2.3)%
$ 4.7
$ (2.0)
$ (5.8)
________
n.m. = not meaningful
The most significant element of our Automotive cost of sales is material cost which makes up approximately two-thirds of the total amount. The remaining
portion includes labor costs, depreciation and amortization, engineering, and policy, product warranty and recall campaigns.
The most significant factors which influence a region's profitability are industry volume and market share. While not as significant as industry volume and
market share, another factor affecting profitability is the relative mix of vehicles (cars, trucks, crossovers) sold. Variable profit is a key indicator of product
profitability. Variable profit is defined as revenue less material cost, freight, the variable component of manufacturing expense and policy, warranty and
recall-related costs. Vehicles with higher selling prices generally have higher variable profit.
Refer to the regional sections of the MD&A for additional information on volume and mix.
In the year ended December 31, 2015 favorable Other was due primarily to: (1) favorable net foreign currency effect of $6.9 billion due primarily to the
weakening of the Euro, Brazilian Real, Canadian Dollar (CAD), British Pound and Mexican Peso against the U.S. Dollar, partially offset by further Venezuela
Bolivar Fuerte (BsF) devaluation; (2) a decrease in recall campaign and courtesy transportation charges of $2.8 billion, including the $0.9 billion catch-up
adjustment; (3) decreased material and freight costs of $2.2 billion; (4) a net decrease in separation charges of $0.4 billion primarily related to the Bochum
plant closing in GME in 2014; (5) favorable intangible asset amortization of $0.3 billion; and (6) decreased costs of $0.3 billion related to parts and
accessories sales; partially offset by (7) an increase in engineering expense of $0.4 billion; (8) an increase in warranty and policy costs of $0.3 billion; and (9)
costs related to the change in our business model in Russia of $0.2 billion.
In the year ended December 31, 2014 unfavorable Other was due primarily to: (1) increased recall campaign and courtesy transportation charges of $3.5
billion, including the $0.9 billion catch-up adjustment; (2) increased material and freight cost including new launches of $2.7 billion; (3) unfavorable effect
resulting from the reversal of the Korea wage litigation accrual in 2013 in GMIO of $0.7 billion; (4) restructuring charges related to the Bochum plant closing
in GME of $0.5 billion; (5) increased depreciation on equipment on operating lease related to daily rental vehicles of $0.3 billion; and (6) charges related to
flood damage of $0.1 billion; partially offset by (7) favorable net foreign currency effect of $1.0 billion due primarily to the weakening of the Brazilian Real,
Russian Ruble, Euro and CAD against the U.S. Dollar, partially offset by the BsF devaluation; and (8) favorable intangible asset amortization of $0.6 billion.
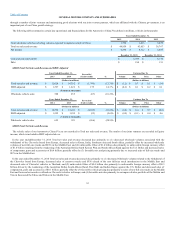
GMNA $ 7,589
$ 6,912
$ 677
31
28
3
GME 2,879
3,172
(293)
57
53
4
GMIO 2,067
2,242
(175)
60
58
2
GMSA 1,229
1,316
(87)
53
37
16
Total $ 13,764
$ 13,642
$ 122
39
36
3
Days on hand is calculated as Inventories divided by Automotive cost of sales for the years ended December 31, 2015 and 2014 multiplied by 360.
27