General Motors 2015 Annual Report Download - page 5
Download and view the complete annual report
Please find page 5 of the 2015 General Motors annual report below. You can navigate through the pages in the report by either clicking on the pages listed below, or by using the keyword search tool below to find specific information within the annual report.-
 1
1 -
 2
2 -
 3
3 -
 4
4 -
 5
5 -
 6
6 -
 7
7 -
 8
8 -
 9
9 -
 10
10 -
 11
11 -
 12
12 -
 13
13 -
 14
14 -
 15
15 -
 16
16 -
17
-
18
-
19
-
20
-
21
-
22
-
23
-
24
-
25
-
26
-
27
-
28
-
29
-
30
-
31
-
32
-
33
-
34
-
35
-
36
-
37
-
38
-
39
-
40
-
41
-
42
-
43
-
44
-
45
-
46
-
47
-
48
-
49
-
50
-
51
-
52
-
53
-
54
-
55
-
56
-
57
-
58
-
59
-
60
-
61
-
62
-
63
-
64
-
65
-
66
-
67
-
68
-
69
-
70
-
71
-
72
-
73
-
74
-
75
-
76
-
77
-
78
-
79
-
80
-
81
-
82
-
83
-
84
-
85
-
86
-
87
-
88
-
89
-
90
-
91
-
92
-
93
-
94
-
95
-
96
-
97
-
98
-
99
-
100
-
101
-
102
-
103
-
104
-
105
-
106
-
107
-
108
-
109
-
110
-
111
-
112
-
113
-
114
-
115
-
116
-
117
-
118
-
119
-
120
-
121
-
122
-
123
-
124
-
125
-
126
-
127
-
128
-
129
-
130
-
131
-
132
-
133
-
134
-
135
-
136
-
137
-
138
-
139
-
140
-
141
-
142
-
143
-
144
-
145
-
146
-
147
-
148
-
149
-
150
-
151
-
152
-
153
-
154
-
155
-
156
-
157
-
158
-
159
-
160
-
161
-
162
 |
 |
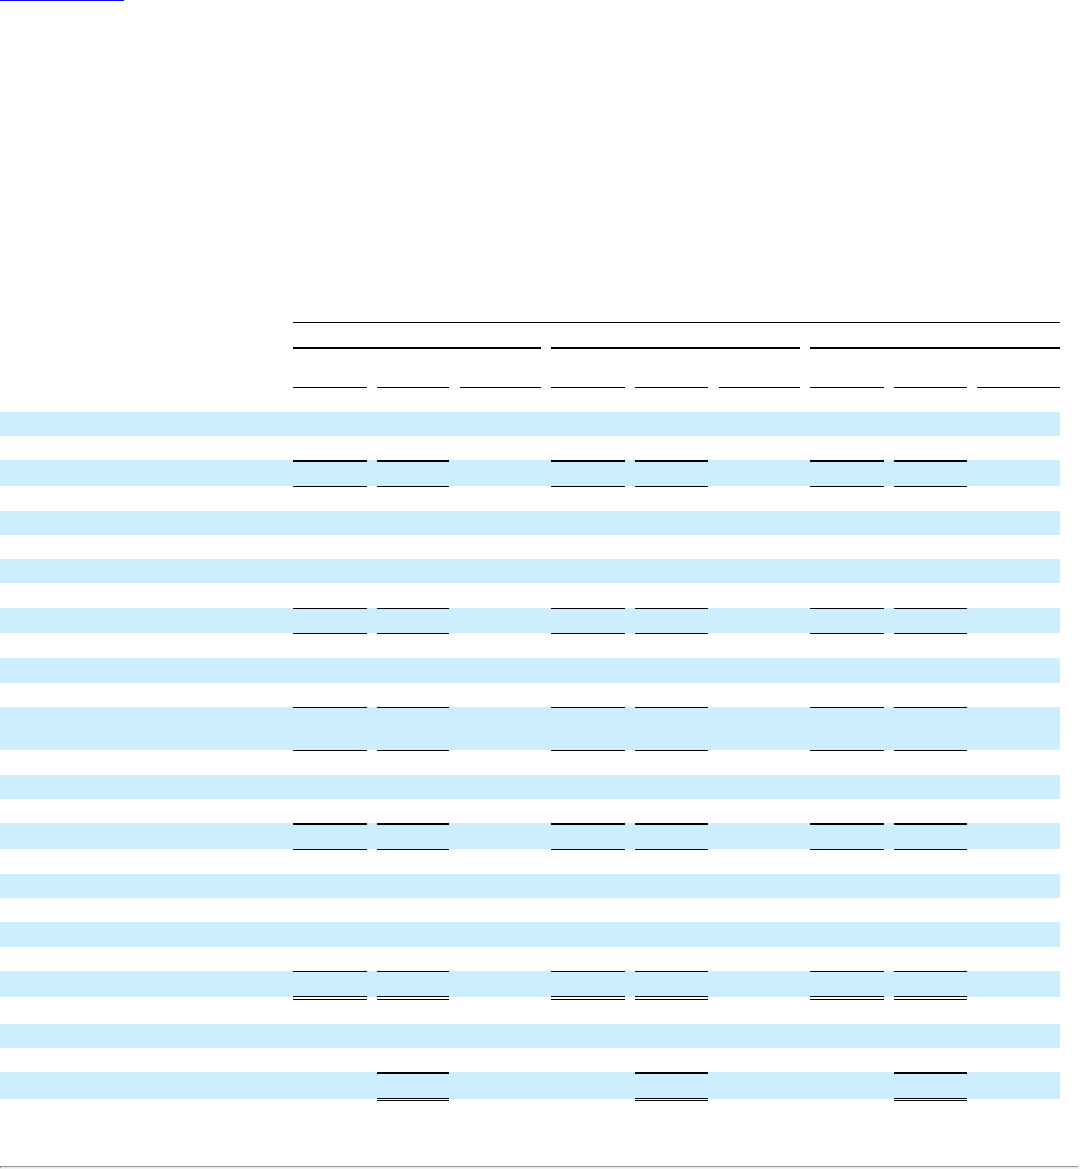
Table of Contents
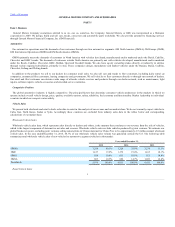
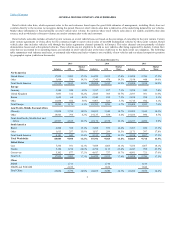
Retail vehicle sales data, which represents sales to the end customers based upon the good faith estimates of management, including fleets, does not
correlate directly to the revenue we recognize during the period. However retail vehicle sales data is indicative of the underlying demand for our vehicles.
Market share information is based primarily on retail vehicle sales volume. In countries where retail vehicle sales data is not readily available other data
sources, such as wholesale or forecast volumes, are used to estimate sales to the end customers.
Retail vehicle sales data includes all sales by joint ventures on a total vehicle basis, not based on the percentage of ownership in the joint venture. Certain
joint venture agreements in China allow for the contractual right to report vehicle sales of non-GM trademarked vehicles by those joint ventures. Retail
vehicle sales data includes vehicles sold through the dealer registration channel (primarily in Europe). This sales channel consists primarily of dealer
demonstrator, loaner and self-registered vehicles. These vehicles are not eligible to be sold as new vehicles after being registered by dealers. Certain fleet
sales that are accounted for as operating leases are included in retail vehicle sales at the time of delivery to the daily rental car companies. The following
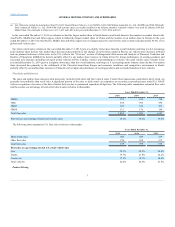
table summarizes total industry retail sales, or estimated sales where retail sales volume is not available, of new vehicles and our related competitive position
by geographic region (vehicles in thousands):
United States 17,852
3,082
17.3%
16,859
2,935
17.4%
15,894
2,786
17.5%
Other 3,666
530
14.5%
3,345
478
14.3%
3,196
448
14.0%
Total North America 21,518
3,612
16.8%
20,204
3,413
16.9%
19,090
3,234
16.9%
Germany 3,540
244
6.9%
3,357
237
7.1%
3,258
242
7.4%
United Kingdom 3,063
312
10.2%
2,845
305
10.7%
2,597
301
11.6%
Russia 1,622
68
4.2%
2,540
189
7.5%
2,834
258
9.1%
Other 11,064
552
5.0%
9,963
525
5.3%
9,715
592
6.1%
Total Europe 19,289
1,176
6.1%
18,705
1,256
6.7%
18,404
1,393
7.6%
China(a) 25,054
3,730
14.9%
24,035
3,540
14.7%
22,202
3,160
14.2%
Other 18,943
795
4.2%
19,137
838
4.4%
19,035
890
4.7%
Total Asia/Pacific, Middle East and
Africa 43,997
4,525
10.3%
43,172
4,378
10.1%
41,237
4,050
9.8%
Brazil 2,568
388
15.1%
3,498
579
16.6%
3,767
650
17.3%
Other 1,613
257
15.9%
1,817
299
16.5%
2,171
387
17.8%
Total South America 4,181
645
15.4%
5,315
878
16.5%
5,938
1,037
17.5%
Cars 7,566
931
12.3%
7,688
1,085
14.1%
7,556
1,067
14.1%
Trucks 5,184
1,274
24.6%
4,754
1,113
23.4%
4,247
998
23.5%
Crossovers 5,102
877
17.2%
4,417
737
16.7%
4,091
721
17.6%
Total U.S. 17,852
3,082
17.3%
16,859
2,935
17.4%
15,894
2,786
17.5%
SGMS
1,711
1,710
1,516
SGMW and FAW-GM
2,019
1,830
1,644
Total China 25,054
3,730
14.9%
24,035
3,540
14.7%
22,202
3,160
14.2%
2