General Motors 2015 Annual Report Download - page 69
Download and view the complete annual report
Please find page 69 of the 2015 General Motors annual report below. You can navigate through the pages in the report by either clicking on the pages listed below, or by using the keyword search tool below to find specific information within the annual report.-
 1
1 -
2
-
3
-
4
-
5
-
6
-
7
-
8
-
9
-
10
-
11
-
12
-
13
-
14
-
15
-
16
-
17
-
18
-
19
-
20
-
21
-
22
-
23
-
24
-
25
-
26
-
27
-
28
-
29
-
30
-
31
-
32
-
33
-
34
-
35
-
36
-
37
-
38
-
39
-
40
-
41
-
42
-
43
-
44
-
45
-
46
-
47
-
48
-
49
-
50
-
51
-
52
-
53
-
54
-
55
-
56
-
57
-
58
-
 59
59 -
 60
60 -
 61
61 -
 62
62 -
 63
63 -
 64
64 -
 65
65 -
 66
66 -
 67
67 -
 68
68 -
 69
69 -
 70
70 -
 71
71 -
 72
72 -
 73
73 -
 74
74 -
 75
75 -
 76
76 -
 77
77 -
 78
78 -
 79
79 -
80
-
81
-
82
-
83
-
84
-
85
-
86
-
87
-
88
-
89
-
90
-
91
-
92
-
93
-
94
-
95
-
96
-
97
-
98
-
99
-
100
-
101
-
102
-
103
-
104
-
105
-
106
-
107
-
108
-
109
-
110
-
111
-
112
-
113
-
114
-
115
-
116
-
117
-
118
-
119
-
120
-
121
-
122
-
123
-
124
-
125
-
126
-
127
-
128
-
129
-
130
-
131
-
132
-
133
-
134
-
135
-
136
-
137
-
138
-
139
-
140
-
141
-
142
-
143
-
144
-
145
-
146
-
147
-
148
-
149
-
150
-
151
-
152
-
153
-
154
-
155
-
156
-
157
-
158
-
159
-
160
-
161
-
162
 |
 |

Table of Contents
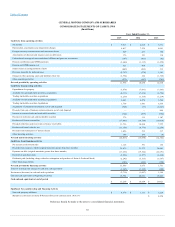
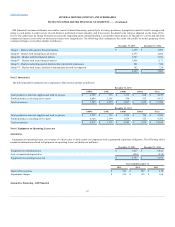
Cash, cash equivalents and time deposits
$ 7,730
$ 7,633
Available-for-sale securities
U.S. government and agencies 2
$ 5,329
$ 7,557
Corporate debt 2
6,267
7,984
Money market funds 1
2,275
2,480
Sovereign debt 2
1,219
824
Total available-for-sale securities
15,090
18,845
Trading securities – sovereign debt 2
581
1,698
Total marketable securities (including securities classified as cash equivalents)
$ 15,671
$ 20,543
Available-for-sale securities, primarily money market funds 1
$ 1,340
$ 1,427
Restricted cash, cash equivalents and time deposits
833
846
Total restricted cash and marketable securities
$ 2,173
$ 2,273
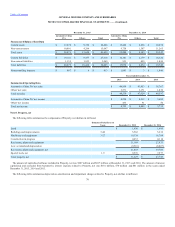
Due in one year or less
$ 10,843
Due between one and five years
1,998
Total available-for-sale securities with contractual maturities
$ 12,841
Marketable securities classified as cash equivalents totaled $7.5 billion and $11.3 billion at December 31, 2015 and 2014 and consisted of U.S.
government and agency securities, corporate debt, money market funds and sovereign debt.
Sales proceeds from investments classified as available-for-sale and sold prior to maturity were $7.9 billion, $5.9 billion and $4.7 billion in the years ended
December 31, 2015, 2014 and 2013. Cumulative unrealized gains and losses on available-for-sale securities and net unrealized gains and losses on trading
securities were insignificant at and in the years ended December 31, 2015, 2014 and 2013.
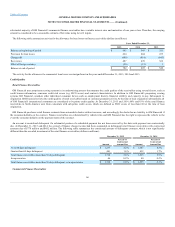
The following table summarizes the components of GM Financial receivables, net (dollars in millions):
Finance receivables $ 29,124
$ 8,209
$ 37,333
$ 25,623
$ 7,606
$ 33,229
Less: allowance for loan losses (735)
(47)
(782)
(655)
(40)
(695)
GM Financial receivables, net $ 28,389
$ 8,162
$ 36,551
$ 24,968
$ 7,566
$ 32,534
Fair value of GM Financial receivables, net
$ 36,707
$ 33,106
Allowance for loan losses classified as current
$ (601)
$ (529)
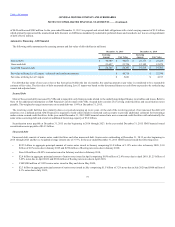
GM Financial estimates the fair value of retail finance receivables using observable and unobservable inputs within a cash flow model, a Level 3 input. The
inputs reflect assumptions regarding expected prepayments, deferrals, delinquencies, recoveries and charge-offs of the loans within the portfolio. The cash
flow model produces an estimated amortization schedule of the finance receivables which is the basis for the calculation of the series of cash flows that derive
the fair value of the portfolio. The series of cash flows is calculated and discounted using a weighted-average cost of capital or current interest rates. The
weighted-average cost of capital uses unobservable debt and equity percentages, an unobservable cost of equity and an observable cost of debt based on
companies with a similar credit rating and maturity profile as the portfolio. Macroeconomic factors could affect the credit performance of the portfolio and
therefore could potentially affect the assumptions used in GM Financial's cash flow model. A
65