Humana 2003 Annual Report Download - page 112
Download and view the complete annual report
Please find page 112 of the 2003 Humana annual report below. You can navigate through the pages in the report by either clicking on the pages listed below, or by using the keyword search tool below to find specific information within the annual report.-
 1
1 -
2
-
3
-
4
-
5
-
6
-
7
-
8
-
9
-
10
-
11
-
12
-
13
-
14
-
15
-
16
-
17
-
18
-
19
-
20
-
21
-
22
-
23
-
24
-
25
-
26
-
27
-
28
-
29
-
30
-
31
-
32
-
33
-
34
-
35
-
36
-
37
-
38
-
39
-
40
-
41
-
42
-
43
-
44
-
45
-
46
-
47
-
48
-
49
-
50
-
51
-
52
-
53
-
54
-
55
-
56
-
57
-
58
-
59
-
60
-
61
-
62
-
63
-
64
-
65
-
66
-
67
-
68
-
69
-
70
-
71
-
72
-
73
-
74
-
75
-
76
-
77
-
78
-
79
-
80
-
81
-
82
-
83
-
84
-
85
-
86
-
87
-
88
-
89
-
90
-
91
-
92
-
93
-
94
-
95
-
96
-
97
-
98
-
99
-
100
-
101
-
 102
102 -
 103
103 -
 104
104 -
 105
105 -
 106
106 -
 107
107 -
 108
108 -
 109
109 -
 110
110 -
 111
111 -
 112
112 -
 113
113 -
 114
114 -
 115
115 -
 116
116 -
 117
117 -
 118
118
 |
 |

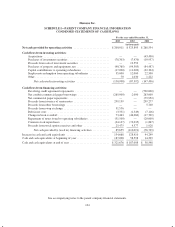
Humana Inc.
SCHEDULE I—PARENT COMPANY FINANCIAL INFORMATION
CONDENSED STATEMENTS OF CASH FLOWS
For the year ended December 31,
2003 2002 2001
(in thousands)
Net cash provided by operating activities ......................... $200,011 $ 325,893 $ 268,534
Cash flows from investing activities:
Acquisitions .............................................. — — (43,490)
Purchases of investment securities ............................. (78,303) (7,470) (10,937)
Proceeds from sale of investment securities ..................... — 12,553 —
Purchases of property and equipment, net ....................... (90,765) (94,505) (84,487)
Capital contributions to operating subsidiaries ................... (17,000) (11,000) (32,304)
Surplus note redemption from operating subsidiaries .............. 35,000 12,000 22,500
Other .................................................... 70 1,030 1,222
Net cash used in investing activities ....................... (150,998) (87,392) (147,496)
Cash flows from financing activities:
Revolving credit agreement repayments ........................ — — (520,000)
Net conduit commercial paper borrowings ...................... (265,000) 2,000 263,000
Net commercial paper repayments ............................. — — (79,952)
Proceeds from issuance of senior notes ......................... 299,139 — 299,277
Proceeds from other borrowings .............................. — — 5,700
Proceeds from swap exchange ................................ 31,556 — —
Debt issue costs ........................................... (3,331) (1,549) (7,116)
Change in book overdraft .................................... 73,463 (46,084) (17,709)
Repayment of notes issued to operating subsidiaries ............... (31,500) — (20,000)
Common stock repurchases .................................. (44,147) (74,035) (1,867)
Proceeds from stock option exercises and other .................. 25,475 9,577 1,928
Net cash provided by (used in) financing activities ............ 85,655 (110,091) (76,739)
Increase in cash and cash equivalents .............................. 134,668 128,410 44,299
Cash and cash equivalents at beginning of year ....................... 187,008 58,598 14,299
Cash and cash equivalents at end of year ............................ $321,676 $ 187,008 $ 58,598
See accompanying notes to the parent company financial statements.
104