Humana 2003 Annual Report Download - page 91
Download and view the complete annual report
Please find page 91 of the 2003 Humana annual report below. You can navigate through the pages in the report by either clicking on the pages listed below, or by using the keyword search tool below to find specific information within the annual report.-
 1
1 -
2
-
3
-
4
-
5
-
6
-
7
-
8
-
9
-
10
-
11
-
12
-
13
-
14
-
15
-
16
-
17
-
18
-
19
-
20
-
21
-
22
-
23
-
24
-
25
-
26
-
27
-
28
-
29
-
30
-
31
-
32
-
33
-
34
-
35
-
36
-
37
-
38
-
39
-
40
-
41
-
42
-
43
-
44
-
45
-
46
-
47
-
48
-
49
-
50
-
51
-
52
-
53
-
54
-
55
-
56
-
57
-
58
-
59
-
60
-
61
-
62
-
63
-
64
-
65
-
66
-
67
-
68
-
69
-
70
-
71
-
72
-
73
-
74
-
75
-
76
-
77
-
78
-
79
-
80
-
 81
81 -
 82
82 -
 83
83 -
 84
84 -
 85
85 -
 86
86 -
 87
87 -
 88
88 -
 89
89 -
 90
90 -
 91
91 -
 92
92 -
 93
93 -
 94
94 -
 95
95 -
 96
96 -
 97
97 -
 98
98 -
 99
99 -
 100
100 -
 101
101 -
102
-
103
-
104
-
105
-
106
-
107
-
108
-
109
-
110
-
111
-
112
-
113
-
114
-
115
-
116
-
117
-
118
 |
 |

Humana Inc.
NOTES TO CONSOLIDATED FINANCIAL STATEMENTS—(Continued)
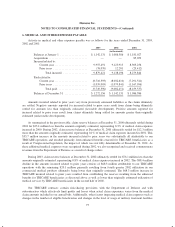
A summary of our stock options outstanding and exercisable was as follows at December 31, 2003:
Stock Options Outstanding Stock Options Exercisable
Range of Exercise Prices Shares
Weighted
Average
Remaining
Contractual Life
Weighted
Average Exercise
Price Shares
Weighted
Average Exercise
Price
$6.50 to $ 9.59 3,591,281 7.65 Years $ 8.69 1,682,533 $ 8.08
9.62 to 15.63 4,228,688 5.16 Years 14.26 2,957,256 14.98
16.46 to 20.16 1,736,208 6.25 Years 19.26 1,191,208 19.21
21.25 to 26.94 137,800 2.64 Years 22.98 137,800 22.98
$6.50 to $26.94 9,693,977 6.24 Years $13.22 5,968,797 $14.06
At December 31, 2002, there were 7,905,414 options exercisable with a weighted average exercise price
of $13.54.
Compensation expense related to variable-based stock option awards and to modifications to fixed-based
stock option awards was not material for 2003, 2002, and 2001. The effects on net income and earnings per share
if we had applied the fair value recognition provisions of FASB Statement No. 123, Accounting for Stock-Based
Compensation, to our fixed-based stock option awards is included in Note 2.
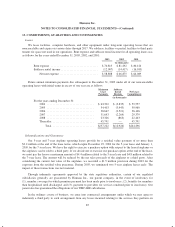
The weighted average fair value of each option granted during 2003, 2002 and 2001 is provided below. The
fair value was estimated on the date of grant using the Black-Scholes pricing model with the following weighted
average assumptions for the years ended December 31, 2003, 2002 and 2001:
2003 2002 2001
Weighted average fair value at grant date ................. $ 5.33 $ 6.26 $ 5.53
Dividend yield ...................................... None None None
Expected volatility ................................... 44.5% 44.9% 44.7%
Risk-free interest rate ................................ 3.4% 4.9% 4.9%
Expected option life (years) ........................... 6.5 5.6 5.4
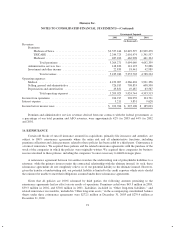
11. EARNINGS PER COMMON SHARE COMPUTATION
Detail supporting the computation of basic and diluted earnings per common share was as follows for the
years ended December 31, 2003, 2002 and 2001:
2003 2002 2001
(in thousands, except per share results)
Net income available for common stockholders ..... $228,934 $142,755 $117,171
Weighted average outstanding shares of common
stock used to compute basic earnings per
common share ............................. 158,968 163,489 164,071
Dilutive effect of:
Employee stock options .................... 1,240 999 811
Restricted stock awards .................... 1,752 3,313 2,426
Shares used to compute diluted earnings per
common share ............................. 161,960 167,801 167,308
Basic earnings per common share ................ $ 1.44 $ 0.87 $ 0.71
Diluted earnings per common share ............... $ 1.41 $ 0.85 $ 0.70
83