Humana 2003 Annual Report Download - page 12
Download and view the complete annual report
Please find page 12 of the 2003 Humana annual report below. You can navigate through the pages in the report by either clicking on the pages listed below, or by using the keyword search tool below to find specific information within the annual report.-
 1
1 -
 2
2 -
 3
3 -
 4
4 -
 5
5 -
 6
6 -
 7
7 -
 8
8 -
 9
9 -
 10
10 -
 11
11 -
 12
12 -
 13
13 -
 14
14 -
 15
15 -
 16
16 -
 17
17 -
 18
18 -
 19
19 -
 20
20 -
 21
21 -
 22
22 -
23
-
24
-
25
-
26
-
27
-
28
-
29
-
30
-
31
-
32
-
33
-
34
-
35
-
36
-
37
-
38
-
39
-
40
-
41
-
42
-
43
-
44
-
45
-
46
-
47
-
48
-
49
-
50
-
51
-
52
-
53
-
54
-
55
-
56
-
57
-
58
-
59
-
60
-
61
-
62
-
63
-
64
-
65
-
66
-
67
-
68
-
69
-
70
-
71
-
72
-
73
-
74
-
75
-
76
-
77
-
78
-
79
-
80
-
81
-
82
-
83
-
84
-
85
-
86
-
87
-
88
-
89
-
90
-
91
-
92
-
93
-
94
-
95
-
96
-
97
-
98
-
99
-
100
-
101
-
102
-
103
-
104
-
105
-
106
-
107
-
108
-
109
-
110
-
111
-
112
-
113
-
114
-
115
-
116
-
117
-
118
 |
 |

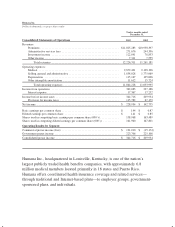
of business: fully insured medical, administrative services only, or ASO, and specialty. The Government segment
consists of members enrolled in government-sponsored programs, and includes three lines of business:
Medicare+Choice, Medicaid, and TRICARE. We identified our segments in accordance with the aggregation
provisions of Statement of Financial Accounting Standards No. 131, Disclosures About Segments of an
Enterprise and Related Information which is consistent with information used by our Chief Executive Officer in
managing our business. The segment information aggregates products with similar economic characteristics.
These characteristics include the nature of customer groups, pricing, benefits, and underwriting requirements.
The results of each segment are measured by income before income taxes. We allocate all selling, general
and administrative expenses, investment and other income, interest expense, and goodwill, but no other assets or
liabilities, to our segments. Members served by our two segments generally utilize the same medical provider
networks, enabling us to obtain more favorable contract terms with providers. Our segments also share overhead
costs and assets. As a result, the profitability of each segment is interdependent.
Strategy
Our business strategy centers on increasing Commercial segment profitability while building on our existing
strength in the Government segment and exploring opportunities under the recently enacted Medicare
Prescription Drug, Improvement, and Modernization Act, or DIMA. Our strategy to increase Commercial
segment profitability focuses on providing solutions for employers to the rising cost of health care through the
use of innovative and consumer-choice product designs which are supported by service excellence and industry-
leading electronic capabilities, including education, tools, and technologies provided primarily through the
Internet. The intent of our Commercial segment strategy is to enable us to further penetrate high potential
commercial markets and to transform the traditional experience for both employers and members in order to
achieve a high degree of consumer satisfaction and loyalty.
Our Products
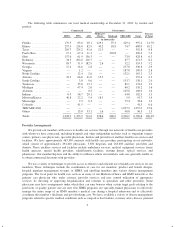
The following table presents our segment membership, premiums and ASO fees by product for the year
ended December 31, 2003:
Medical
Membership
Specialty
Membership Premiums ASO Fees
Total
Premiums and
ASO Fees
Percent of Total
Premiums and
ASO Fees
Commercial:
Fully insured:
HMO .................. 1,028,900 — $ 2,871,697 $ — $ 2,871,697 23.7%
PPO ................... 1,323,900 — 3,369,109 — 3,369,109 27.9%
Total fully insured ...... 2,352,800 — 6,240,806 — 6,240,806 51.6%
Administrative services only . . 712,400 — — 122,846 122,846 1.0%
Specialty .................. — 1,668,100 320,206 — 320,206 2.7%
Total Commercial ...... 3,065,200 1,668,100 6,561,012 122,846 6,683,858 55.3%
Government: .................
Medicare+Choice ........... 328,600 — 2,527,446 — 2,527,446 20.9%
Medicaid .................. 468,900 — 487,100 — 487,100 4.0%
TRICARE ................. 1,849,700 — 2,249,725 — 2,249,725 18.6%
TRICARE ASO ............ 1,057,200 — — 148,830 148,830 1.2%
Total Government ...... 3,704,400 — 5,264,271 148,830 5,413,101 44.7%
Total ................. 6,769,600 1,668,100 $11,825,283 $271,676 $12,096,959 100.0%
4