Humana 2003 Annual Report Download - page 49
Download and view the complete annual report
Please find page 49 of the 2003 Humana annual report below. You can navigate through the pages in the report by either clicking on the pages listed below, or by using the keyword search tool below to find specific information within the annual report.-
 1
1 -
2
-
3
-
4
-
5
-
6
-
7
-
8
-
9
-
10
-
11
-
12
-
13
-
14
-
15
-
16
-
17
-
18
-
19
-
20
-
21
-
22
-
23
-
24
-
25
-
26
-
27
-
28
-
29
-
30
-
31
-
32
-
33
-
34
-
35
-
36
-
37
-
38
-
 39
39 -
 40
40 -
 41
41 -
 42
42 -
 43
43 -
 44
44 -
 45
45 -
 46
46 -
 47
47 -
 48
48 -
 49
49 -
 50
50 -
 51
51 -
 52
52 -
 53
53 -
 54
54 -
 55
55 -
 56
56 -
 57
57 -
 58
58 -
 59
59 -
60
-
61
-
62
-
63
-
64
-
65
-
66
-
67
-
68
-
69
-
70
-
71
-
72
-
73
-
74
-
75
-
76
-
77
-
78
-
79
-
80
-
81
-
82
-
83
-
84
-
85
-
86
-
87
-
88
-
89
-
90
-
91
-
92
-
93
-
94
-
95
-
96
-
97
-
98
-
99
-
100
-
101
-
102
-
103
-
104
-
105
-
106
-
107
-
108
-
109
-
110
-
111
-
112
-
113
-
114
-
115
-
116
-
117
-
118
 |
 |

The Government segment’s SG&A expense ratio was 13.5% for 2002, increasing 70 basis points compared
to 12.8% in 2001. This increase resulted from the items discussed above and a change in the mix of revenues. A
higher proportion of revenues was generated from administrative services fees, primarily from the TRICARE
Regions 2 and 5 acquisition and the implementation of the TRICARE for Life benefit programs effective October
1, 2001. ASO business carries a much higher SG&A ratio than fully insured business.
Depreciation and amortization was $120.7 million in 2002, a decrease of $40.8 million, or 25.3%, from
$161.5 million in 2001. As discussed in Note 2 to the consolidated financial statements, we ceased amortizing
goodwill on January 1, 2002 in accordance with adopting a new accounting standard. This decreased goodwill
amortization by $55 million. On a comparable basis, depreciation and amortization was $106.5 million in 2001,
excluding goodwill amortization expense. The $14.2 million increase in 2002 compared to 2001, as adjusted,
resulted from capital expenditures primarily related to our technology initiatives and a full year of amortization
of other intangible assets related to the acquisition of TRICARE Regions 2 and 5 on May 31, 2001.
Interest Expense
Interest expense was $17.3 million in 2002, a decrease of $8.0 million from $25.3 million in 2001. This
decrease primarily resulted from lower interest rates.
Income Taxes
Our effective tax rate in 2002 of 32% decreased 4% compared to the 36% effective tax rate in 2001. The
lower effective tax rate in 2002 primarily resulted from the cessation of non-deductible goodwill amortization on
January 1, 2002, partially offset by higher state income taxes and a lower proportion of tax-exempt investment
income to pretax income. In addition, during 2002, the Internal Revenue Service completed their audit of all open
years prior to 2000, which resulted in a favorable adjustment to the estimated accrual for income taxes of
approximately $32.6 million. This was offset by an increase of approximately $24.5 million in the capital loss
valuation allowance after we reevaluated probable capital gain realization in the allowable carryforward period
based upon our capital gain experience beginning in 2000 and consideration of alternative tax planning strategies.
See Note 7 to the consolidated financial statements for a complete reconciliation to the federal statutory rate.
Liquidity
Our consolidated liquidity continued to strengthen in 2003, with cash and cash equivalents increasing to
$931.4 million at December 31, 2003 from $721.4 million at December 31, 2002. Because we operate as a
holding company, our parent company is dependent upon dividends and administrative expense reimbursements
from our subsidiaries, most of which are subject to regulatory restrictions. Our parent company liquidity also
improved during 2003. Cash, cash equivalents and short-term investments at our parent company amounted to
$399.4 million at December 31, 2003, increasing $212.4 million from $187.0 million at December 31, 2002. The
primary source for the increase in cash and cash equivalents has been the increase in our net income.
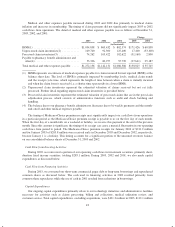
The change in cash and cash equivalents for the years ended December 31, 2003, 2002 and 2001 is
summarized as follows:
2003 2002 2001
(in thousands)
Net cash provided by operating activities ........... $413,140 $ 321,408 $ 148,958
Net cash used in investing activities ............... (373,163) (128,157) (118,807)
Net cash provided by (used in) financing activities .... 170,070 (123,314) (36,293)
Increase (decrease) in cash and cash equivalents ...... $210,047 $ 69,937 $ (6,142)
41