Humana 2003 Annual Report Download - page 51
Download and view the complete annual report
Please find page 51 of the 2003 Humana annual report below. You can navigate through the pages in the report by either clicking on the pages listed below, or by using the keyword search tool below to find specific information within the annual report.-
 1
1 -
2
-
3
-
4
-
5
-
6
-
7
-
8
-
9
-
10
-
11
-
12
-
13
-
14
-
15
-
16
-
17
-
18
-
19
-
20
-
21
-
22
-
23
-
24
-
25
-
26
-
27
-
28
-
29
-
30
-
31
-
32
-
33
-
34
-
35
-
36
-
37
-
38
-
39
-
40
-
 41
41 -
 42
42 -
 43
43 -
 44
44 -
 45
45 -
 46
46 -
 47
47 -
 48
48 -
 49
49 -
 50
50 -
 51
51 -
 52
52 -
 53
53 -
 54
54 -
 55
55 -
 56
56 -
 57
57 -
 58
58 -
 59
59 -
 60
60 -
 61
61 -
62
-
63
-
64
-
65
-
66
-
67
-
68
-
69
-
70
-
71
-
72
-
73
-
74
-
75
-
76
-
77
-
78
-
79
-
80
-
81
-
82
-
83
-
84
-
85
-
86
-
87
-
88
-
89
-
90
-
91
-
92
-
93
-
94
-
95
-
96
-
97
-
98
-
99
-
100
-
101
-
102
-
103
-
104
-
105
-
106
-
107
-
108
-
109
-
110
-
111
-
112
-
113
-
114
-
115
-
116
-
117
-
118
 |
 |

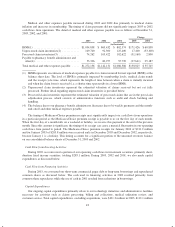
Medical and other expenses payable increased during 2003 and 2002 due primarily to medical claims
inflation and increases in membership. The timing of claim payments did not significantly impact 2003 or 2002
cash flows from operations. The detail of medical and other expenses payable was as follows at December 31,
2003, 2002, and 2001:
Change
2003 2002 2001 2003 2002
(in thousands)
IBNR(1) ................................ $1,034,858 $ 863,432 $ 802,574 $171,426 $ 60,858
Unprocessed claim inventories(2) ............ 109,700 92,300 125,400 17,400 (33,100)
Processed claim inventories(3) .............. 74,262 105,422 102,622 (31,160) 2,800
Payable to pharmacy benefit administrator and
other(4) ............................... 53,336 80,977 55,790 (27,641) 25,187
Total medical and other expenses payable ..... $1,272,156 $1,142,131 $1,086,386 $130,025 $ 55,745
(1) IBNR represents an estimate of medical expenses payable for claims incurred but not reported (IBNR) at the
balance sheet date. The level of IBNR is primarily impacted by membership levels, medical claim trends
and the receipt cycle time, which represents the length of time between when a claim is initially incurred
and when the claim form is received (i.e. a shorter time span results in a lower IBNR).
(2) Unprocessed claim inventories represent the estimated valuation of claims received but not yet fully
processed. Further detail regarding unprocessed claim inventories is provided below.
(3) Processed claim inventories represent the estimated valuation of processed claims that are in the post claim
adjudication process, which consists of administrative functions such as audit and check batching and
handling.
(4) The balance due to our pharmacy benefit administrator fluctuates due to bi-weekly payments and the month-
end cutoff and other medical expenses payable.
The timing of Medicare+Choice premium receipts may significantly impact our cash flows from operations
in a particular period as the Medicare+Choice premium receipt is payable to us on the first day of each month.
When the first day of a month falls on a weekend or holiday, we receive this payment at the end of the previous
month. Since this amount is significant, the timing of its receipt can cause a material fluctuation in our operating
cash flows from period to period. The Medicare+Choice premium receipts for January 2004 of $211.9 million
and for January 2003 of $205.8 million were received early in December 2003 and December 2002, respectively,
because January 1 is a holiday. This timing accounts for a significant portion of the unearned revenues balance
on our consolidated balance sheets at December 31, 2003 and 2002.
Cash Flow from Investing Activities
During 2003, we reinvested a portion of our operating cash flows in investment securities, primarily short-
duration fixed income securities, totaling $283.1 million. During 2003, 2002 and 2001, we also made capital
expenditures as discussed below.
Cash Flow from Financing Activities
During 2003, we converted our short-term commercial paper debt to long-term borrowings and repurchased
common shares as discussed below. The cash used in financing activities in 2002 resulted primarily from
common share repurchases while the use of cash in 2001 resulted from reductions in borrowings.
Capital Expenditures
Our ongoing capital expenditures primarily relate to our technology initiatives and administrative facilities
necessary for activities such as claims processing, billing and collections, medical utilization review, and
customer service. Total capital expenditures, excluding acquisitions, were $101.3 million in 2003, $112.1 million
43