Humana 2003 Annual Report Download - page 19
Download and view the complete annual report
Please find page 19 of the 2003 Humana annual report below. You can navigate through the pages in the report by either clicking on the pages listed below, or by using the keyword search tool below to find specific information within the annual report.-
 1
1 -
2
-
3
-
4
-
5
-
6
-
7
-
8
-
 9
9 -
 10
10 -
 11
11 -
 12
12 -
 13
13 -
 14
14 -
 15
15 -
 16
16 -
 17
17 -
 18
18 -
 19
19 -
 20
20 -
 21
21 -
 22
22 -
 23
23 -
 24
24 -
 25
25 -
 26
26 -
 27
27 -
 28
28 -
 29
29 -
30
-
31
-
32
-
33
-
34
-
35
-
36
-
37
-
38
-
39
-
40
-
41
-
42
-
43
-
44
-
45
-
46
-
47
-
48
-
49
-
50
-
51
-
52
-
53
-
54
-
55
-
56
-
57
-
58
-
59
-
60
-
61
-
62
-
63
-
64
-
65
-
66
-
67
-
68
-
69
-
70
-
71
-
72
-
73
-
74
-
75
-
76
-
77
-
78
-
79
-
80
-
81
-
82
-
83
-
84
-
85
-
86
-
87
-
88
-
89
-
90
-
91
-
92
-
93
-
94
-
95
-
96
-
97
-
98
-
99
-
100
-
101
-
102
-
103
-
104
-
105
-
106
-
107
-
108
-
109
-
110
-
111
-
112
-
113
-
114
-
115
-
116
-
117
-
118
 |
 |

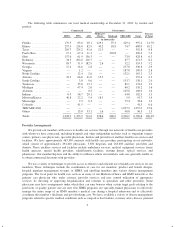
Medical membership under these various arrangements was as follows at December 31, 2003 and 2002:
Commercial Segment Government Segment Consol.
Total
Medical
Fully
Insured ASO
Total
Segment
Medicare+
Choice Medicaid TRICARE
TRICARE
ASO
Total
Segment
Medical Membership:
December 31, 2003
Capitated HMO hospital
system based ......... 128,000 — 128,000 38,800 13,600 — — 52,400 180,400
Capitated HMO physician
group based .......... 71,700 — 71,700 5,900 220,000 — — 225,900 297,600
Risk-sharing ........... 68,000 — 68,000 157,500 204,800 — — 362,300 430,300
Other ................. 2,085,100 712,400 2,797,500 126,400 30,500 1,849,700 1,057,200 3,063,800 5,861,300
Total ............. 2,352,800 712,400 3,065,200 328,600 468,900 1,849,700 1,057,200 3,704,400 6,769,600
December 31, 2002
Capitated HMO hospital
system based ......... 147,400 — 147,400 47,100 11,900 — — 59,000 206,400
Capitated HMO physician
group based .......... 73,900 — 73,900 10,700 292,900 — — 303,600 377,500
Risk-sharing ........... 67,700 — 67,700 160,200 164,200 — — 324,400 392,100
Other ................. 2,051,300 652,200 2,703,500 126,100 37,000 1,755,800 1,048,700 2,967,600 5,671,100
Total ............. 2,340,300 652,200 2,992,500 344,100 506,000 1,755,800 1,048,700 3,654,600 6,647,100
Medical Membership Distribution:
December 31, 2003
Capitated HMO hospital
system based ......... 5.4% — 4.2% 11.8% 2.9% — — 1.4% 2.7%
Capitated HMO physician
group based .......... 3.0% — 2.3% 1.8% 46.9% — — 6.1% 4.4%
Risk-sharing ........... 2.9% — 2.2% 47.9% 43.7% — — 9.8% 6.4%
All other membership .... 88.7% 100.0% 91.3% 38.5% 6.5% 100.0% 100.0% 82.7% 86.5%
Total ............. 100.0% 100.0% 100.0% 100.0% 100.0% 100.0% 100.0% 100.0% 100.0%
December 31, 2002
Capitated HMO hospital
system based ......... 6.3% — 4.9% 13.7% 2.4% — — 1.6% 3.1%
Capitated HMO physician
group based .......... 3.2% — 2.5% 3.1% 57.9% — — 8.3% 5.7%
Risk-sharing ........... 2.9% — 2.3% 46.6% 32.4% — — 8.9% 5.9%
Other ................. 87.6% 100.0% 90.3% 36.6% 7.3% 100.0% 100.0% 81.2% 85.3%
Total ............. 100.0% 100.0% 100.0% 100.0% 100.0% 100.0% 100.0% 100.0% 100.0%
Capitation expense as a percentage of total medical expense was as follows for the years ended
December 31, 2003, 2002 and 2001:
2003 2002 2001
(dollars in thousands)
Medical Expenses:
Capitated HMO expense ............... $ 597,244 6.0% $ 603,617 6.6% $ 546,594 6.6%
Other medical expense ................. 9,282,177 94.0% 8,534,579 93.4% 7,733,250 93.4%
Consolidated medical expense ...... $9,879,421 100.0% $9,138,196 100.0% $8,279,844 100.0%
11