Humana 2003 Annual Report Download - page 43
Download and view the complete annual report
Please find page 43 of the 2003 Humana annual report below. You can navigate through the pages in the report by either clicking on the pages listed below, or by using the keyword search tool below to find specific information within the annual report.-
 1
1 -
2
-
3
-
4
-
5
-
6
-
7
-
8
-
9
-
10
-
11
-
12
-
13
-
14
-
15
-
16
-
17
-
18
-
19
-
20
-
21
-
22
-
23
-
24
-
25
-
26
-
27
-
28
-
29
-
30
-
31
-
32
-
 33
33 -
 34
34 -
 35
35 -
 36
36 -
 37
37 -
 38
38 -
 39
39 -
 40
40 -
 41
41 -
 42
42 -
 43
43 -
 44
44 -
 45
45 -
 46
46 -
 47
47 -
 48
48 -
 49
49 -
 50
50 -
 51
51 -
 52
52 -
 53
53 -
54
-
55
-
56
-
57
-
58
-
59
-
60
-
61
-
62
-
63
-
64
-
65
-
66
-
67
-
68
-
69
-
70
-
71
-
72
-
73
-
74
-
75
-
76
-
77
-
78
-
79
-
80
-
81
-
82
-
83
-
84
-
85
-
86
-
87
-
88
-
89
-
90
-
91
-
92
-
93
-
94
-
95
-
96
-
97
-
98
-
99
-
100
-
101
-
102
-
103
-
104
-
105
-
106
-
107
-
108
-
109
-
110
-
111
-
112
-
113
-
114
-
115
-
116
-
117
-
118
 |
 |

Overview
Net income was $228.9 million, or $1.41 per diluted share, in 2003 compared to net income of $142.8
million, or $0.85 per diluted share, in 2002. The increase in earnings resulted primarily from significant
improvement in operating earnings for the Commercial segment and a decrease in expenses for asset
impairments and other unusual items.
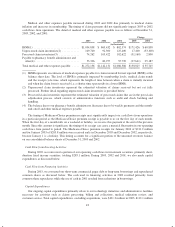
Premium Revenues and Medical Membership
Premium revenues increased 8.2%, to $11.8 billion, for 2003 compared to $10.9 billion for 2002. Higher
premium revenues resulted primarily from increases in fully insured commercial per member premiums and an
increase in TRICARE premiums. Items impacting per member premiums include changes in premium and
government reimbursement rates, as well as changes in geographic mix of membership, the mix of product
offerings, and the mix of benefit plans selected by our membership.
Commercial segment premium revenues increased 12.4%, to $6.6 billion, for 2003 compared to $5.8 billion
for 2002. This improvement resulted primarily from increases in per member premiums in the 12% to 14% range
for 2003 on our fully insured commercial business. Additionally, our fully insured commercial medical
membership increased 0.5% or 12,500 members, to 2,352,800 at December 31, 2003 compared to 2,340,300 at
December 31, 2002.
We anticipate 2004 Commercial fully insured per member premiums will increase approximately 8% to
10%. This reduction in the rate of increase in Commercial fully insured per member premiums is expected to
occur as a result of a changing mix of business, reductions in the level of benefits purchased by our customers,
and a more competitive pricing environment. The change in the mix of business, which is expected to result from
growth in our individual products and changes in the products purchased by our large group customers, and
reductions in the level of benefit purchased will result in a commensurate reduction in medical cost trends. We
expect Commercial fully insured and ASO medical membership to achieve a combined increase for all of 2004 of
between 6% and 9%, with most of the growth occurring in the ASO business.
Government segment premium revenues increased 3.3%, to $5.3 billion, for 2003 compared to $5.1 billion
for 2002. This increase primarily was attributable to our TRICARE business, partially offset by a reduction in our
Medicare+Choice membership. Rates were increased upon annual renewal of our base TRICARE contract and
led to an increase in TRICARE premium revenues of $248.3 million, or 12.4%, compared to 2002.
Medicare+Choice membership was 328,600 at December 31, 2003 compared to 344,100 at December 31, 2002, a
decline of 15,500 members, or 4.5%. This decline resulted as we exited several counties in some of our markets
effective January 1, 2003 and general attrition in certain markets as a result of annual changes to benefit designs.
Per member premiums increased in the 4% to 6% range for 2003. Due to DIMA, we are expecting a return to
growth, with MedicareAdvantage membership increasing to approximately 340,000 to 360,000 members by the
end of 2004 and increases in per member premiums in the range of 8% to 10%.
Administrative Services Fees
Administrative services fees for 2003 were $271.7 million, an increase of $27.3 million from $244.4 million
for 2002. For the Commercial segment, administrative services fees increased $19.6 million, or 19.0%, to $122.8
million. This increase corresponds to the higher level of ASO membership at December 31, 2003, which was
712,400 members, compared to 652,200 members at December 31, 2002 and also reflects an increase in the
average fees received per member. Administrative services fees for the Government segment increased
$7.6 million when comparing 2003 to 2002. This increase resulted from contractual adjustments related to
TRICARE for Life, a program for seniors in which we provide medical benefit administrative services.
35