Humana 2003 Annual Report Download - page 81
Download and view the complete annual report
Please find page 81 of the 2003 Humana annual report below. You can navigate through the pages in the report by either clicking on the pages listed below, or by using the keyword search tool below to find specific information within the annual report.-
 1
1 -
2
-
3
-
4
-
5
-
6
-
7
-
8
-
9
-
10
-
11
-
12
-
13
-
14
-
15
-
16
-
17
-
18
-
19
-
20
-
21
-
22
-
23
-
24
-
25
-
26
-
27
-
28
-
29
-
30
-
31
-
32
-
33
-
34
-
35
-
36
-
37
-
38
-
39
-
40
-
41
-
42
-
43
-
44
-
45
-
46
-
47
-
48
-
49
-
50
-
51
-
52
-
53
-
54
-
55
-
56
-
57
-
58
-
59
-
60
-
61
-
62
-
63
-
64
-
65
-
66
-
67
-
68
-
69
-
70
-
 71
71 -
 72
72 -
 73
73 -
 74
74 -
 75
75 -
 76
76 -
 77
77 -
 78
78 -
 79
79 -
 80
80 -
 81
81 -
 82
82 -
 83
83 -
 84
84 -
 85
85 -
 86
86 -
 87
87 -
 88
88 -
 89
89 -
 90
90 -
 91
91 -
92
-
93
-
94
-
95
-
96
-
97
-
98
-
99
-
100
-
101
-
102
-
103
-
104
-
105
-
106
-
107
-
108
-
109
-
110
-
111
-
112
-
113
-
114
-
115
-
116
-
117
-
118
 |
 |

Humana Inc.
NOTES TO CONSOLIDATED FINANCIAL STATEMENTS—(Continued)
no longer supporting the carrying value of the center’s long-lived assets. Accordingly, we reduced the carrying
value of these long-lived assets to their estimated fair value resulting in non-cash impairment expenses of
approximately $17.2 million ($10.5 million after tax) during the first quarter of 2003.
We used an independent third party appraisal to assist us in evaluating the fair value of the buildings. The
non-cash impairment expenses are included with selling, general and administrative expenses in the
accompanying consolidated statements of income.
Based upon our decision to sell some of the buildings previously used in our Jacksonville and San Antonio
customer service operations, we classified them as held for sale and ceased depreciating these buildings effective
July 1, 2003. The estimated costs to sell the building were not material to the estimated fair value. The impact of
ceasing depreciation of the buildings was not material to our results of operations.
Accelerated Depreciation
After finalizing plans during the first quarter of 2003 to abandon software used in our operations by March
2003, we reduced the estimated useful life of the software effective January 1, 2003. Accordingly, we accelerated
the depreciation of the remaining software balance of approximately $13.5 million ($8.3 million after tax) during
the first quarter of 2003.
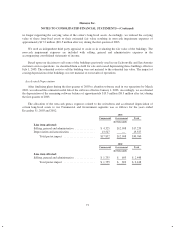
The allocation of the non-cash pretax expenses related to the writedown and accelerated depreciation of
certain long-lived assets to our Commercial and Government segments was as follows for the years ended
December 31, 2003 and 2002:
2003
Commercial Government Total
(in thousands)
Line item affected:
Selling, general and administrative .............. $ 4,325 $12,908 $17,233
Depreciation and amortization .................. 13,527 — 13,527
Total pretax impact ...................... $17,852 $12,908 $30,760
2002
Commercial Government Total
(in thousands)
Line item affected:
Selling, general and administrative .............. $ 1,755 $ 693 $ 2,448
Total pretax impact ...................... $ 1,755 $ 693 $ 2,448
73