Humana 2003 Annual Report Download - page 46
Download and view the complete annual report
Please find page 46 of the 2003 Humana annual report below. You can navigate through the pages in the report by either clicking on the pages listed below, or by using the keyword search tool below to find specific information within the annual report.-
 1
1 -
2
-
3
-
4
-
5
-
6
-
7
-
8
-
9
-
10
-
11
-
12
-
13
-
14
-
15
-
16
-
17
-
18
-
19
-
20
-
21
-
22
-
23
-
24
-
25
-
26
-
27
-
28
-
29
-
30
-
31
-
32
-
33
-
34
-
35
-
 36
36 -
 37
37 -
 38
38 -
 39
39 -
 40
40 -
 41
41 -
 42
42 -
 43
43 -
 44
44 -
 45
45 -
 46
46 -
 47
47 -
 48
48 -
 49
49 -
 50
50 -
 51
51 -
 52
52 -
 53
53 -
 54
54 -
 55
55 -
 56
56 -
57
-
58
-
59
-
60
-
61
-
62
-
63
-
64
-
65
-
66
-
67
-
68
-
69
-
70
-
71
-
72
-
73
-
74
-
75
-
76
-
77
-
78
-
79
-
80
-
81
-
82
-
83
-
84
-
85
-
86
-
87
-
88
-
89
-
90
-
91
-
92
-
93
-
94
-
95
-
96
-
97
-
98
-
99
-
100
-
101
-
102
-
103
-
104
-
105
-
106
-
107
-
108
-
109
-
110
-
111
-
112
-
113
-
114
-
115
-
116
-
117
-
118
 |
 |

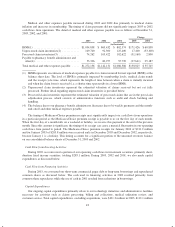
Comparison of Results of Operations for 2002 and 2001
Certain financial data for our two segments was as follows for the years ended December 31, 2002
and 2001:
Change
2002 2001 Dollars Percentage
(in thousands, except ratios)
Premium revenues:
Fully insured ................................. $ 5,499,033 $4,941,888 $ 557,145 11.3%
Specialty ..................................... 337,295 304,714 32,581 10.7%
Total Commercial ......................... 5,836,328 5,246,602 589,726 11.2%
Medicare+Choice .................................. 2,629,597 2,909,478 (279,881) (9.6)%
TRICARE ................................... 2,001,474 1,341,557 659,917 49.2%
Medicaid .................................... 462,998 441,324 21,674 4.9%
Total Government ......................... 5,094,069 4,692,359 401,710 8.6%
Total ................................ $10,930,397 $9,938,961 $ 991,436 10.0%
Administrative services fees:
Commercial .................................. $ 103,203 $ 84,204 $ 18,999 22.6%
Government .................................. 141,193 52,886 88,307 167.0%
Total .................................... $ 244,396 $ 137,090 $ 107,306 78.3%
Income (loss) before income taxes: ....................
Commercial .................................. $ (15,174) $ (2,013) $ (13,161) 653.8%
Government .................................. 225,108 185,093 40,015 21.6%
Total .................................... $ 209,934 $ 183,080 $ 26,854 14.7%
Medical expense ratios:
Commercial .................................. 83.5% 83.1% 0.4
Government .................................. 83.8% 83.6% 0.2
Total .................................... 83.6% 83.3% 0.3
SG&A expense ratios:
Commercial .................................. 18.0% 17.6% 0.4
Government .................................. 13.5% 12.8% 0.7
Total .................................... 15.9% 15.3% 0.6
Medical membership was as follows at December 31, 2002 and 2001:
Change
2002 2001 Members Percentage
Commercial segment medical members:
Fully insured ...................................... 2,340,300 2,301,300 39,000 1.7%
ASO ............................................. 652,200 592,500 59,700 10.1%
Total Commercial .............................. 2,992,500 2,893,800 98,700 3.4%
Government segment medical members: ....................
Medicare+Choice .................................. 344,100 393,900 (49,800) (12.6)%
Medicaid ......................................... 506,000 490,800 15,200 3.1%
TRICARE ........................................ 1,755,800 1,714,600 41,200 2.4%
TRICARE ASO .................................... 1,048,700 942,700 106,000 11.2%
Total Government .............................. 3,654,600 3,542,000 112,600 3.2%
Total medical membership ............................... 6,647,100 6,435,800 211,300 3.3%
38