Humana 2003 Annual Report Download - page 56
Download and view the complete annual report
Please find page 56 of the 2003 Humana annual report below. You can navigate through the pages in the report by either clicking on the pages listed below, or by using the keyword search tool below to find specific information within the annual report.-
 1
1 -
2
-
3
-
4
-
5
-
6
-
7
-
8
-
9
-
10
-
11
-
12
-
13
-
14
-
15
-
16
-
17
-
18
-
19
-
20
-
21
-
22
-
23
-
24
-
25
-
26
-
27
-
28
-
29
-
30
-
31
-
32
-
33
-
34
-
35
-
36
-
37
-
38
-
39
-
40
-
41
-
42
-
43
-
44
-
45
-
 46
46 -
 47
47 -
 48
48 -
 49
49 -
 50
50 -
 51
51 -
 52
52 -
 53
53 -
 54
54 -
 55
55 -
 56
56 -
 57
57 -
 58
58 -
 59
59 -
 60
60 -
 61
61 -
 62
62 -
 63
63 -
 64
64 -
 65
65 -
 66
66 -
67
-
68
-
69
-
70
-
71
-
72
-
73
-
74
-
75
-
76
-
77
-
78
-
79
-
80
-
81
-
82
-
83
-
84
-
85
-
86
-
87
-
88
-
89
-
90
-
91
-
92
-
93
-
94
-
95
-
96
-
97
-
98
-
99
-
100
-
101
-
102
-
103
-
104
-
105
-
106
-
107
-
108
-
109
-
110
-
111
-
112
-
113
-
114
-
115
-
116
-
117
-
118
 |
 |

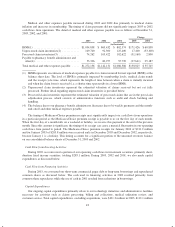
As of December 31, 2003, we maintained aggregate statutory capital and surplus of $1,086.5 million in our
state regulated health insurance subsidiaries. Each of these subsidiaries was in compliance with applicable
statutory requirements which aggregated $640.4 million. Although the minimum required levels of equity are
largely based on premium volume, product mix, and the quality of assets held, minimum requirements can vary
significantly at the state level. Certain states rely on risk-based capital requirements, or RBC, to define the
required levels of equity. RBC is a model developed by the National Association of Insurance Commissioners to
monitor an entity’s solvency. This calculation indicates recommended minimum levels of required capital and
surplus and signals regulatory measures should actual surplus fall below these recommended levels. If RBC were
adopted by all states at December 31, 2003, each of our subsidiaries would be in compliance and we would have
$381.9 million of aggregate capital and surplus above any of the levels that require corrective action under RBC.
One TRICARE subsidiary under the Regions 3 and 4 contract with the Department of Defense is required to
maintain current assets at least equivalent to its current liabilities. We were in compliance with this requirement
at December 31, 2003.
Future Liquidity Needs
Because of the items discussed in this Liquidity section, we believe that funds from future operating cash
flows and funds available under our credit agreements and commercial paper program are sufficient to meet short
and intermediate-term liquidity needs. We also believe these sources of funds are adequate to allow us to fund
selected expansion opportunities, as well as to fund capital requirements.
Market Risk-Sensitive Financial Instruments and Positions
The level of our pretax earnings is subject to risk due to changes in investment income from our fixed
income portfolio which is partially offset by both our debt position and the short-term duration of the fixed
income investment portfolio.
We evaluated the impact on our investment income and debt expense resulting from a hypothetical change
in interest rates of 100, 200 and 300 basis points over the next twelve-month period, as reflected in the following
table. The modeling technique used to calculate the pro forma net change in pretax earnings considered the cash
flows related to fixed income investments and debt, which are subject to interest rate changes during a
prospective twelve-month period. This evaluation measures parallel shifts in interest rates and may not account
for certain unpredictable events that may effect interest income, including, among others, unexpected changes of
cash flow into and out of the portfolio, shifts in the asset mix between tax and tax-exempt securities, and spread
changes specific to various investment categories. In the past ten years, changes in 3 month LIBOR rates during
the year have exceeded 300 basis points twice, have not changed between 200 and 300 basis points, have
changed between 100 and 200 basis points once and have changed by less than 100 basis points seven times.
LIBOR was 1.15% at December 31, 2003. Our model assumed the maximum possible reduction in LIBOR could
not exceed 115 basis points.
Increase (decrease) in pretax
earnings given an interest rate
decrease of X basis points
Increase (decrease) in pretax
earnings given an interest rate
increase of X basis points
(300) (200) (100) 100 200 300
(in thousands)
2003
Fixed income portfolio ................... $(13,105) $(11,977) $(9,757) $ 9,169 $ 18,068 $ 26,844
Debt .................................. 5,567 5,567 5,567 (5,567) (11,134) (16,700)
Total ............................. $ (7,538) $ (6,410) $(4,190) $ 3,602 $ 6,934 $ 10,144
2002
Fixed income portfolio ................... $(21,793) $(15,708) $(8,848) $ 9,229 $ 17,253 $ 24,876
Debt .................................. 4,019 4,019 4,019 (4,019) (8,038) (12,057)
Total ............................. $(17,774) $(11,689) $(4,829) $ 5,210 $ 9,215 $ 12,819
48