Humana 2003 Annual Report Download - page 48
Download and view the complete annual report
Please find page 48 of the 2003 Humana annual report below. You can navigate through the pages in the report by either clicking on the pages listed below, or by using the keyword search tool below to find specific information within the annual report.-
 1
1 -
2
-
3
-
4
-
5
-
6
-
7
-
8
-
9
-
10
-
11
-
12
-
13
-
14
-
15
-
16
-
17
-
18
-
19
-
20
-
21
-
22
-
23
-
24
-
25
-
26
-
27
-
28
-
29
-
30
-
31
-
32
-
33
-
34
-
35
-
36
-
37
-
 38
38 -
 39
39 -
 40
40 -
 41
41 -
 42
42 -
 43
43 -
 44
44 -
 45
45 -
 46
46 -
 47
47 -
 48
48 -
 49
49 -
 50
50 -
 51
51 -
 52
52 -
 53
53 -
 54
54 -
 55
55 -
 56
56 -
 57
57 -
 58
58 -
59
-
60
-
61
-
62
-
63
-
64
-
65
-
66
-
67
-
68
-
69
-
70
-
71
-
72
-
73
-
74
-
75
-
76
-
77
-
78
-
79
-
80
-
81
-
82
-
83
-
84
-
85
-
86
-
87
-
88
-
89
-
90
-
91
-
92
-
93
-
94
-
95
-
96
-
97
-
98
-
99
-
100
-
101
-
102
-
103
-
104
-
105
-
106
-
107
-
108
-
109
-
110
-
111
-
112
-
113
-
114
-
115
-
116
-
117
-
118
 |
 |

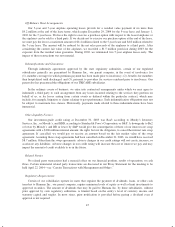
Administrative Services Fees
Administrative services fees for 2002 were $244.4 million, an increase of $107.3 million from $137.1
million for 2001. For the Commercial segment, administrative services fees increased $19.0 million, or 22.6%, to
$103.2 million. This increase corresponds to the higher level of ASO membership at December 31, 2002, which
was 652,200 members, compared to 592,500 members at December 31, 2001 and also reflects an increase in the
average fees received per member. Administrative services fees for the Government segment increased $88.3
million when comparing 2002 to 2001. The TRICARE Regions 2 and 5 acquisition accounted for $51 million of
this increase, with the remainder attributable to the implementation of the TRICARE for Life benefits program
effective October 1, 2001. TRICARE for Life is a program for seniors where we provide medical benefit
administrative services.
Investment and Other Income
Investment and other income totaled $86.4 million in 2002, a decrease of $32.4 million from $118.8 million
in 2001. Net realized losses of $10.1 million in 2002 compared to net realized gains of $13.9 million in 2001. Net
realized losses in 2002 included impairment losses of $27.2 million primarily related to privately held venture
capital investment securities after an evaluation indicated that a decline in fair value below the cost basis was
other than temporary. Lower interest rates also decreased investment income $10.9 million in 2002 compared to
2001. The average yield on investment securities was 4.6% in 2002, declining from 5.1% in 2001.
Medical Expense
The medical expense ratio for 2002 was 83.6%, increasing 30 basis points from 83.3% in 2001.
The Commercial segment medical expense ratio for 2002 was 83.5%, increasing 40 basis points from 83.1%
in 2001. This increase primarily was due to the shift in the mix of our fully insured commercial medical
membership to a heavier concentration of larger group sizes. Large group commercial membership represented
approximately 65% of our fully insured commercial membership at December 31, 2002 compared to 62% at
December 31, 2001. Large group membership traditionally experiences a higher medical expense ratio and a
lower selling, general and administrative expense ratio than does our small group membership.
The Government segment medical expense ratio for 2002 was 83.8%, increasing 20 basis points from 83.6%
in 2001. This increase primarily was attributable to TRICARE. As discussed previously, TRICARE medical
expense increased due to expanded benefits for TRICARE beneficiaries mandated by Congress, an increase in
eligible beneficiaries, and an increase in the use of Humana’s provider network rather than MTFs. Since these
actions were not originally specified in our contracts or were for items that the Department of Defense retains
financial risk, we were entitled to equitable revenue adjustments through the change order and BPA processes.
These higher medical expenses combined with the associated higher premium revenues resulted in an overall
increase in the Government medical expense ratio.
SG&A Expense
The SG&A expense ratio for 2002 was 15.9%, increasing 60 basis points from 15.3% for 2001. This
increase primarily resulted from an increase in severance and related employee benefit expenses of $36.0 million,
long-lived asset impairments of $2.4 million, and the establishment of reserves for a contingent contractual
provider dispute and other items associated with our 1997 acquisition of Physician Corporation of America, or
PCA of $30.1 million.
The Commercial segment’s SG&A expense ratio was 18.0% for 2002, increasing 40 basis points from 2001
of 17.6%. This increase was the result of the items discussed above.
40