Humana 2003 Annual Report Download - page 50
Download and view the complete annual report
Please find page 50 of the 2003 Humana annual report below. You can navigate through the pages in the report by either clicking on the pages listed below, or by using the keyword search tool below to find specific information within the annual report.-
 1
1 -
2
-
3
-
4
-
5
-
6
-
7
-
8
-
9
-
10
-
11
-
12
-
13
-
14
-
15
-
16
-
17
-
18
-
19
-
20
-
21
-
22
-
23
-
24
-
25
-
26
-
27
-
28
-
29
-
30
-
31
-
32
-
33
-
34
-
35
-
36
-
37
-
38
-
39
-
 40
40 -
 41
41 -
 42
42 -
 43
43 -
 44
44 -
 45
45 -
 46
46 -
 47
47 -
 48
48 -
 49
49 -
 50
50 -
 51
51 -
 52
52 -
 53
53 -
 54
54 -
 55
55 -
 56
56 -
 57
57 -
 58
58 -
 59
59 -
 60
60 -
61
-
62
-
63
-
64
-
65
-
66
-
67
-
68
-
69
-
70
-
71
-
72
-
73
-
74
-
75
-
76
-
77
-
78
-
79
-
80
-
81
-
82
-
83
-
84
-
85
-
86
-
87
-
88
-
89
-
90
-
91
-
92
-
93
-
94
-
95
-
96
-
97
-
98
-
99
-
100
-
101
-
102
-
103
-
104
-
105
-
106
-
107
-
108
-
109
-
110
-
111
-
112
-
113
-
114
-
115
-
116
-
117
-
118
 |
 |

The primary drivers of operating cash flow in our business are premium collections and medical claim
payments. Because premiums generally are collected in advance of claims payments by a period up to several
months in many instances, our business should normally produce strong cash flows during a period of increasing
enrollment. Conversely, cash flows would be negatively impacted during a period of shrinking enrollment, as
was the case for us during 2001. The exception to this general rule is the collection of TRICARE BPAs and
change orders, which may occur up to six months after the end of a contract year. Other activities that impact our
cash flows are the collection of ASO fees and investment income and the payment of operating expenses, interest
expense and taxes.
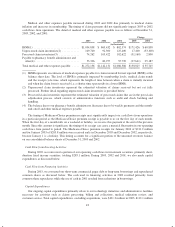
During 2003, our operating cash flows were not substantially impacted by a change in the timing of
premium and ASO fee collections or medical claim payments, as both amounts generally increased with inflation
and membership growth. However, during 2002, our operating cash flows were negatively impacted by slower
cash collections of premium and ASO fee receivables when TRICARE receivables increased by $174 million as
detailed in the following table:
December 31, Change
2003 2002 2001 2003 2002
(in thousands)
TRICARE:
Base receivable ................... $266,656 $197,544 $166,763 $ 69,112 $ 30,781
Bid price adjustments (BPAs) ........ 92,875 104,044 — (11,169) 104,044
Change orders .................... 7,073 57,630 18,423 (50,557) 39,207
366,604 359,218 185,186 7,386 174,032
Less: long-term portion of BPAs ..... (38,794) (86,471) — 47,677 (86,471)
TRICARE subtotal ............ 327,810 272,747 185,186 55,063 87,561
Commercial and other .................. 178,577 146,882 148,784 31,695 (1,902)
Allowance for doubtful accounts ......... (40,400) (30,178) (38,539) (10,222) 8,361
Total net receivables ........... $465,987 $389,451 $295,431 $ 76,536 $ 94,020
TRICARE base receivables, which are collected monthly in the ordinary course of business, increased in
2003 as rates under our base TRICARE contract increased upon the annual renewal of the contracts for Regions
3 and 4 and Regions 2 and 5. Total TRICARE receivables significantly increased from 2001 to 2002 primarily
due to change orders and BPAs due to an increase in activity and deployments surrounding military conflicts in
the Middle East.
The timing of payments for claims can significantly impact comparisons of our operating cash flows
between years. During 2001, operating cash flows were reduced by $132.0 million as a result of our paying down
unprocessed claim inventories. Since then, the level of claims inventory has stabilized. The following table
presents the estimated valuation and number of unprocessed claims on hand, performance metrics we regularly
review. Claims on hand represent the estimated number of provider requests for reimbursement that have been
received but not yet processed.
Estimated
Valuation
Claims on
Hand
Number of
Days Claims
On-hand
(dollars in thousands)
December 31, 2000 .......................... $257,400 1,157,900 11.0
December 31, 2001 .......................... $125,400 518,100 5.0
December 31, 2002 .......................... $ 92,300 424,200 4.5
December 31, 2003 .......................... $109,700 443,000 4.9
42