Humana 2003 Annual Report Download - page 8
Download and view the complete annual report
Please find page 8 of the 2003 Humana annual report below. You can navigate through the pages in the report by either clicking on the pages listed below, or by using the keyword search tool below to find specific information within the annual report.-
 1
1 -
 2
2 -
 3
3 -
 4
4 -
 5
5 -
 6
6 -
 7
7 -
 8
8 -
 9
9 -
 10
10 -
 11
11 -
 12
12 -
 13
13 -
 14
14 -
 15
15 -
 16
16 -
 17
17 -
 18
18 -
 19
19 -
20
-
21
-
22
-
23
-
24
-
25
-
26
-
27
-
28
-
29
-
30
-
31
-
32
-
33
-
34
-
35
-
36
-
37
-
38
-
39
-
40
-
41
-
42
-
43
-
44
-
45
-
46
-
47
-
48
-
49
-
50
-
51
-
52
-
53
-
54
-
55
-
56
-
57
-
58
-
59
-
60
-
61
-
62
-
63
-
64
-
65
-
66
-
67
-
68
-
69
-
70
-
71
-
72
-
73
-
74
-
75
-
76
-
77
-
78
-
79
-
80
-
81
-
82
-
83
-
84
-
85
-
86
-
87
-
88
-
89
-
90
-
91
-
92
-
93
-
94
-
95
-
96
-
97
-
98
-
99
-
100
-
101
-
102
-
103
-
104
-
105
-
106
-
107
-
108
-
109
-
110
-
111
-
112
-
113
-
114
-
115
-
116
-
117
-
118
 |
 |

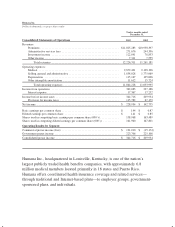
Humana Inc.
Dollars in thousands, except per share results
Twelve months ended
December 31,
Consolidated Statements of Operations 2003 2002
Revenues:
Premiums ....................................................... $11,825,283 $10,930,397
Administrative services fees ........................................ 271,676 244,396
Investment income ............................................... 122,041 78,833
Other income .................................................... 7,311 7,555
Total revenues ............................................... 12,226,311 11,261,181
Operating expenses:
Medical ........................................................ 9,879,421 9,138,196
Selling, general and administrative ................................... 1,858,028 1,775,069
Depreciation .................................................... 115,167 105,006
Other intangible amortization ....................................... 11,612 15,724
Total operating expenses ....................................... 11,864,228 11,033,995
Income from operations ............................................... 362,083 227,186
Interest expense .................................................. 17,367 17,252
Income before income taxes ............................................ 344,716 209,934
Provision for income taxes ......................................... 115,782 67,179
Net income ......................................................... $ 228,934 $ 142,755
Basic earnings per common share ........................................ $ 1.44 $ 0.87
Diluted earnings per common share ...................................... $ 1.41 $ 0.85
Shares used in computing basic earnings per common share (000’s) ............. 158,968 163,489
Shares used in computing diluted earnings per common share (000’s) ........... 161,960 167,801
Operating Results by Segment
Commercial pretax income (loss) ........................................ $ 121,010 $ (15,174)
Government pretax income ............................................. 223,706 225,108
Consolidated pretax income ............................................ $ 344,716 $ 209,934
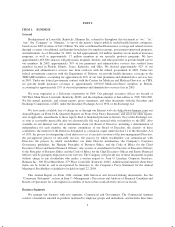
Humana Inc., headquartered in Louisville, Kentucky, is one of the nation’s
largest publicly traded health benefits companies, with approximately 6.8
million medical members located primarily in 18 states and Puerto Rico.
Humana offers coordinated health insurance coverage and related services—
through traditional and Internet-based plans—to employer groups, government-
sponsored plans, and individuals.