Humana 2003 Annual Report Download - page 38
Download and view the complete annual report
Please find page 38 of the 2003 Humana annual report below. You can navigate through the pages in the report by either clicking on the pages listed below, or by using the keyword search tool below to find specific information within the annual report.-
 1
1 -
2
-
3
-
4
-
5
-
6
-
7
-
8
-
9
-
10
-
11
-
12
-
13
-
14
-
15
-
16
-
17
-
18
-
19
-
20
-
21
-
22
-
23
-
24
-
25
-
26
-
27
-
 28
28 -
 29
29 -
 30
30 -
 31
31 -
 32
32 -
 33
33 -
 34
34 -
 35
35 -
 36
36 -
 37
37 -
 38
38 -
 39
39 -
 40
40 -
 41
41 -
 42
42 -
 43
43 -
 44
44 -
 45
45 -
 46
46 -
 47
47 -
 48
48 -
49
-
50
-
51
-
52
-
53
-
54
-
55
-
56
-
57
-
58
-
59
-
60
-
61
-
62
-
63
-
64
-
65
-
66
-
67
-
68
-
69
-
70
-
71
-
72
-
73
-
74
-
75
-
76
-
77
-
78
-
79
-
80
-
81
-
82
-
83
-
84
-
85
-
86
-
87
-
88
-
89
-
90
-
91
-
92
-
93
-
94
-
95
-
96
-
97
-
98
-
99
-
100
-
101
-
102
-
103
-
104
-
105
-
106
-
107
-
108
-
109
-
110
-
111
-
112
-
113
-
114
-
115
-
116
-
117
-
118
 |
 |

TRICARE change orders occur when we perform services or incur costs under the directive of the federal
government that were not originally specified in our contracts. Under federal regulations we are entitled to an
equitable adjustment to the contract price, which results in additional premium revenues. Examples of items that
have necessitated substantial change orders in recent years include congressionally legislated increases in the
level of benefits for TRICARE beneficiaries and the administration of new government programs such as
TRICARE for Life and TRICARE Senior Pharmacy. Like BPAs, we record revenue applicable to change orders
when these amounts are determinable and the collectibility is reasonably assured. Unlike BPAs, where settlement
only occurs at specified intervals, change orders may be negotiated and settled at any time throughout the year.
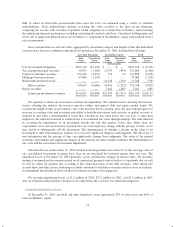
Total TRICARE premium and ASO fee receivables were as follows at December 31, 2003 and 2002:
2003 2002
(in thousands)
TRICARE premiums receivable:
Base receivable ..................................... $254,688 $190,339
Bid price adjustments (BPAs) .......................... 92,875 104,044
Change orders ...................................... 7,073 1,400
Subtotal ....................................... 354,636 295,783
Less: long-term portion of BPAs ....................... (38,794) (86,471)
Total TRICARE premiums receivable ............... $315,842 $209,312
TRICARE ASO fees receivable:
Base receivable ..................................... $ — $ 7,205
Change orders ...................................... 11,968 56,230
Total TRICARE ASO fees receivable ............... $ 11,968 $ 63,435
Our TRICARE contracts also contain risk-sharing provisions with the federal government to minimize
any losses and limit any profits in the event that medical costs for which we are at risk differ from the levels
targeted in our contracts. Amounts receivable from the federal government under such risk-sharing provisions
are included in the BPA receivable above, while amounts payable to the federal government under these
provisions of approximately $17.3 million at December 31, 2003 are included in medical and other expenses
payable in our consolidated balance sheets.
Investment Securities
Investment securities totaled $1,995.8 million, or 38% of total assets at December 31, 2003. Debt securities
totaled $1,960.6 million, or 98% of our total investment portfolio. More than 94% of our debt securities were of
investment-grade quality, with an average credit rating of AA by Standard & Poor’s at December 31, 2003. Most
of the debt securities that are below investment grade are rated at the higher end (B or better) of the non-
investment grade spectrum. Our investment policy limits investments in a single issuer and requires
diversification among various asset types.
Duration is indicative of the relationship between changes in market value to changes in interest rates,
providing a general indication of the sensitivity of the fair values of our debt securities to changes in interest
rates. However, actual market values may differ significantly from estimates based on duration. The average
duration of our debt securities was approximately 3.5 years at December 31, 2003. Based on this duration, a 1%
increase in interest rates would generally decrease the fair value of our debt securities by approximately
$70 million.
Our investment securities are categorized as available for sale and, as a result, are stated at fair value. Fair
value of publicly traded debt and equity securities are based on quoted market prices. Non-traded debt securities
are priced independently by a third party vendor. Fair value of venture capital debt securities that are privately
30