Humana 2003 Annual Report Download - page 78
Download and view the complete annual report
Please find page 78 of the 2003 Humana annual report below. You can navigate through the pages in the report by either clicking on the pages listed below, or by using the keyword search tool below to find specific information within the annual report.-
 1
1 -
2
-
3
-
4
-
5
-
6
-
7
-
8
-
9
-
10
-
11
-
12
-
13
-
14
-
15
-
16
-
17
-
18
-
19
-
20
-
21
-
22
-
23
-
24
-
25
-
26
-
27
-
28
-
29
-
30
-
31
-
32
-
33
-
34
-
35
-
36
-
37
-
38
-
39
-
40
-
41
-
42
-
43
-
44
-
45
-
46
-
47
-
48
-
49
-
50
-
51
-
52
-
53
-
54
-
55
-
56
-
57
-
58
-
59
-
60
-
61
-
62
-
63
-
64
-
65
-
66
-
67
-
 68
68 -
 69
69 -
 70
70 -
 71
71 -
 72
72 -
 73
73 -
 74
74 -
 75
75 -
 76
76 -
 77
77 -
 78
78 -
 79
79 -
 80
80 -
 81
81 -
 82
82 -
 83
83 -
 84
84 -
 85
85 -
 86
86 -
 87
87 -
 88
88 -
89
-
90
-
91
-
92
-
93
-
94
-
95
-
96
-
97
-
98
-
99
-
100
-
101
-
102
-
103
-
104
-
105
-
106
-
107
-
108
-
109
-
110
-
111
-
112
-
113
-
114
-
115
-
116
-
117
-
118
 |
 |

Humana Inc.
NOTES TO CONSOLIDATED FINANCIAL STATEMENTS—(Continued)
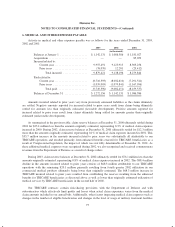
3. INVESTMENT SECURITIES
Investment securities classified as current assets were as follows at December 31, 2003 and 2002:
2003 2002
Amortized
Cost
Gross
Unrealized
Gains
Gross
Unrealized
Losses
Fair
Value
Amortized
Cost
Gross
Unrealized
Gains
Gross
Unrealized
Losses
Fair
Value
(in thousands)
U.S. Government obligations ....... $ 455,305 $ 2,121 $(2,024) $ 455,402 $ 375,059 $ 6,232 $ — $ 381,291
Tax exempt municipal securities .... 686,552 14,056 (1,766) 698,842 586,834 16,249 (566) 602,517
Corporate and other securities ...... 374,568 8,649 (3,407) 379,810 312,667 12,070 (5,597) 319,140
Mortgage-backed securities ........ 84,399 811 (1,251) 83,959 23,606 661 — 24,267
Redeemable preferred stocks ....... 27,686 95 (734) 27,047 19,886 61 (564) 19,383
Debt securities .............. 1,628,510 25,732 (9,182) 1,645,060 1,318,052 35,273 (6,727) 1,346,598
Non-redeemable preferred stocks . . . 31,171 683 (272) 31,582 41,248 321 (1,900) 39,669
Common stocks ................. — — — — 10,813 106 (2,118) 8,801
Equity securities ............. 31,171 683 (272) 31,582 52,061 427 (4,018) 48,470
Investment securities ......... $1,659,681 $26,415 $(9,454) $1,676,642 $1,370,113 $35,700 $(10,745) $1,395,068
Investment securities classified as long-term assets were as follows at December 31, 2003 and 2002:
2003 2002
Amortized
Cost
Gross
Unrealized
Gains
Gross
Unrealized
Losses
Fair
Value
Amortized
Cost
Gross
Unrealized
Gains
Gross
Unrealized
Losses
Fair
Value
(in thousands)
U.S. Government obligations ....... $137,512 $ 1,532 $(101) $138,943 $127,111 $ 3,556 $ — $130,667
Tax exempt municipal securities .... 65,535 1,014 (294) 66,255 55,510 1,350 (194) 56,666
Corporate and other securities ...... 57,994 1,365 (271) 59,088 57,496 1,277 (395) 58,378
Mortgage-backed securities ........ 11,155 116 (44) 11,227 6,122 27 — 6,149
Redeemable preferred stocks ....... 32,625 7,390 — 40,015 31,625 7,377 — 39,002
Debt securities .............. 304,821 11,417 (710) 315,528 277,864 13,587 (589) 290,862
Non-redeemable preferred stocks . . . 2,233 19 (13) 2,239 3,721 35 (217) 3,539
Common stocks ................. 1,400 — — 1,400 6,108 — (1,020) 5,088
Equity securities ............. 3,633 19 (13) 3,639 9,829 35 (1,237) 8,627
Long-term investment
securities ................ $308,454 $11,436 $(723) $319,167 $287,693 $13,622 $(1,826) $299,489
Investment securities with a fair value of $95.4 million at December 31, 2003 and $100.7 million at
December 31, 2002 were on deposit at financial institutions in certain states pursuant to the respective states’
insurance regulations.
70