Proctor and Gamble 2008 Annual Report Download - page 2
Download and view the complete annual report
Please find page 2 of the 2008 Proctor and Gamble annual report below. You can navigate through the pages in the report by either clicking on the pages listed below, or by using the keyword search tool below to find specific information within the annual report.-
 1
1 -
 2
2 -
 3
3 -
 4
4 -
 5
5 -
 6
6 -
 7
7 -
 8
8 -
 9
9 -
 10
10 -
 11
11 -
 12
12 -
 13
13 -
14
-
15
-
16
-
17
-
18
-
19
-
20
-
21
-
22
-
23
-
24
-
25
-
26
-
27
-
28
-
29
-
30
-
31
-
32
-
33
-
34
-
35
-
36
-
37
-
38
-
39
-
40
-
41
-
42
-
43
-
44
-
45
-
46
-
47
-
48
-
49
-
50
-
51
-
52
-
53
-
54
-
55
-
56
-
57
-
58
-
59
-
60
-
61
-
62
-
63
-
64
-
65
-
66
-
67
-
68
-
69
-
70
-
71
-
72
-
73
-
74
-
75
-
76
-
77
-
78
-
79
-
80
-
81
-
82
-
83
-
84
-
85
-
86
 |
 |

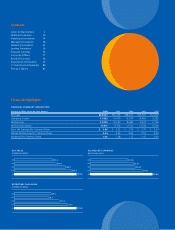
(inbillionsofdollars)
51.4
56.7
68.2
76.5
04
05
06
07
(inbillionsofdollars)
9.4
8.7
11.4
13.4
04
05
06
07
(percommonshare)
2.20
2.53
2.64
3.04
04
05
06
07
Letter to Shareholders 2
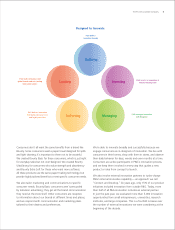
Dening Innovation 10
Investing in Innovation 14
Managing Innovation 18
Delivering Innovation 22
Leading Innovation 26
Financial Contents 35
Corporate Ofcers 77
Board of Directors 78
Shareholder Information 79
11-Year Financial Summary 80
P&G at a Glance 82
Amountsinmillions,exceptpershareamounts 2007 2006 2005 2004
NetSales $76,476 $68,222 $56,741 $51,407
OperatingIncome 15,450 13,249 10,469 9,382
NetEarnings 10,340 8,684 6,923 6,156
NetEarningsMargin 13.5% 12.7% 12.2% 12.0%
BasicNetEarningsPerCommonShare $ 3.22 $ 2.79 $ 2.70 $ 2.34
DilutedNetEarningsPerCommonShare 3.04 2.64 2.53 2.20
DividendsPerCommonShare 1.28 1.15 1.03 0.93