Proctor and Gamble 2008 Annual Report Download - page 47
Download and view the complete annual report
Please find page 47 of the 2008 Proctor and Gamble annual report below. You can navigate through the pages in the report by either clicking on the pages listed below, or by using the keyword search tool below to find specific information within the annual report.-
 1
1 -
2
-
3
-
4
-
5
-
6
-
7
-
8
-
9
-
10
-
11
-
12
-
13
-
14
-
15
-
16
-
17
-
18
-
19
-
20
-
21
-
22
-
23
-
24
-
25
-
26
-
27
-
28
-
29
-
30
-
31
-
32
-
33
-
34
-
35
-
36
-
 37
37 -
 38
38 -
 39
39 -
 40
40 -
 41
41 -
 42
42 -
 43
43 -
 44
44 -
 45
45 -
 46
46 -
 47
47 -
 48
48 -
 49
49 -
 50
50 -
 51
51 -
 52
52 -
 53
53 -
 54
54 -
 55
55 -
 56
56 -
 57
57 -
58
-
59
-
60
-
61
-
62
-
63
-
64
-
65
-
66
-
67
-
68
-
69
-
70
-
71
-
72
-
73
-
74
-
75
-
76
-
77
-
78
-
79
-
80
-
81
-
82
-
83
-
84
-
85
-
86
 |
 |

Management’sDiscussionandAnalysis TheProcter&GambleCompany 45
higherthansegmentaverageunitsellingprices.Thismorethanoffset
theimpactofdisproportionategrowthindevelopingregions,which
havelowersellingpricesthanthesegmentaverage.Skincarevolume
wasupmid-singledigitsdrivenbygrowthonOlaybehindtheDenity
andRegeneristinitiatives.Ourglobalskincaremarketsharewasup
slightly,drivenprimarilybyabouta1pointincreaseinourU.S.market
share.Prestigefragrancesvolumewasuplow-singledigitsandorganic
volumewasuphigh-singledigitsbehindnewproductlauncheson
Dolce&GabbanaandHugoBoss.Retailhaircarevolumewasup
mid-singledigits,ledbyhigh-single-digitgrowthindevelopingmarkets.
Retailhaircarevolumeindevelopedregionswasatasadouble-digit
volumeincreaseonHead&Shoulderswasoffsetbyadouble-digit
volumedeclineonPanteneinNorthAmerica.Haircolorvolume
increasedlow-singledigitsasgrowthonNice‘NEasybehindthe
Perfect10launchmorethanoffsetdeclinesonothercolorbrands.
Professionalhaircarevolumedeclinedmid-singledigitsasgrowth
fromcolorwasmorethanoffsetbydeclinesincareandstyling.
Overall,globalhaircaremarketsharewasinlinewiththeprioryear
level.Volumeindeodorantswasdownlow-singledigitsprimarilydue
tocompetitiveactivityandmarketsoftnessinWesternEurope.
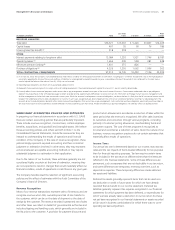
NetearningsinBeautyincreased5%to$2.7billionin2008asthe
impactofhighersaleswaspartiallyoffsetbyalowernetearnings
margin.Netearningsmarginwasdown60-basispointsaslowergross
marginandtheimpactofbaseperioddivestituregainsonminorbrands
morethanoffsetthebenetofalowertaxrateduetogeographic
mix.Grossmarginwasdownduetohighercommoditycosts,which
morethanoffsetthebenetofincreasedvolumescaleleverageand
manufacturingcostsavingsprojects.SG&Aincreasedslightlyas
highermarketingspendingasapercentageofnetsaleswaspartially
offsetbyloweroverheadspendingasapercentageofnetsales.
In2007,Beautynetsalesincreased7%to$17.9billionbehind4%
unitvolumegrowth.Volumegrowthwasdrivenbyinitiativeactivity
acrosscategoriesandcontinuedexpansionindevelopingregions,
wherevolumeincreasedhigh-singledigits.Prestigefragrancesvolume
wasupdouble-digitsbehindTheOne,BossSelectionandBossFemme
fragranceinitiativesandtheadditionofDolce&Gabbana.Skincare
volumewasuphigh-singledigitsbehindtheOlayDenityand
Regeneristproductinitiatives.Haircarevolumegrewmid-singledigits
asaresultofproductinitiativesonPantene,Head&Shouldersand
HerbalEssencesandcontinuedexpansionindevelopingregions.
Beautysalesbenetedfroma1%positivemiximpactprimarilydue
todisproportionategrowthinprestigefragrances,whichhasahigher
thansegmentaverageunitsellingprice.Thiswasoffsetbyhigher
levelsofpromotionalactivity,whichresultedinanegative1%pricing
impact.Favorableforeignexchangecontributed3%tonetsales.Net
earningsincreased8%in2007to$2.6billionprimarilybehindnet
salesgrowth.Earningsmarginincreased15basispointsprimarilydue
tolowerSG&Aasapercentageofnetsalesanddivestituregainson
severalminorBeautybrands,partiallyoffsetbythenegativemiximpact
fromlowerSK-IIshipments.SG&Aimprovedashighermarketing
spendingasapercentageofnetsalestosupportinitiativeactivitywas
morethanoffsetbyloweroverheadexpensesasapercentageofnet
salesresultingfromthebenetofvolumescaleleverageandGillette-
relatedsynergysavings.SK-IIshipmentsweredownin2007dueto
thesalesdisruptioninAsiaresultingfromthevoluntarytemporary
suspensionofSK-IIshipmentsinChinaearlyinthe2007scalyear.
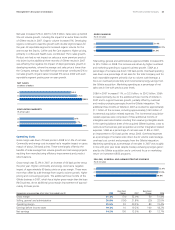
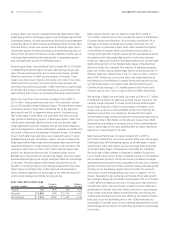
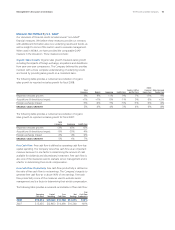
Changevs. Changevs.
(inmillionsofdollars) PriorYear 2007 PriorYear*
Volume +5% n/a +36%
Netsales +11% $7,437 +45%
Netearnings +21% $1,383 +63%
*TheGillettebusinesswasacquiredonOctober1,2005.Therefore,thescal2007growth
ratesareversusabaseperiodthatincludedonly9monthsofGilletteGroomingresults.
Groomingnetsalesincreased11%to$8.3billionin2008.Netsales
wereupbehind5%volumegrowth,a7%favorableforeignexchange
impactanda2%positivepricingimpactdrivenbypriceincreaseson
premiumshavingsystems.Productmixhadanegative3%impacton
netsalesaspositiveproductmixfromgrowthonthepremium-priced
Fusionbrandwasmorethanoffsetbytheimpactofdisproportionate
growthindevelopingregions,wheresellingpricesarebelowthe
segmentaverage.Bladesandrazorsvolumeincreasedhigh-singledigits
behinddouble-digitgrowthindevelopingregionsdrivenprimarilyby
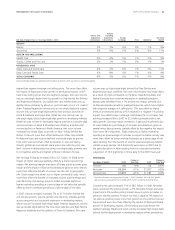
Volume
Volumewith Excluding
Acquisitions Acquisitions Foreign NetSales
NetSalesChangeDriversvs.YearAgo(2008vs.2007) &Divestitures &Divestitures Exchange Price Mix/Other Growth
Beauty 2% 3% 6% 0% 1% 9%
Grooming 5% 6% 7% 2% -3% 11%
HealthCare 4% 4% 5% 1% -1% 9%
Snacks,CoffeeandPetCare 2% 2% 3% 3% -1% 7%
FabricCareandHomeCare 6% 6% 5% 1% -1% 11%
BabyCareandFamilyCare 4% 8% 4% 1% 0% 9%
4% 5% 5% 1% -1% 9%
Salespercentagechangesareapproximationsbasedonquantitativeformulasthatareconsistentlyapplied.