Proctor and Gamble 2008 Annual Report Download - page 45
Download and view the complete annual report
Please find page 45 of the 2008 Proctor and Gamble annual report below. You can navigate through the pages in the report by either clicking on the pages listed below, or by using the keyword search tool below to find specific information within the annual report.-
 1
1 -
2
-
3
-
4
-
5
-
6
-
7
-
8
-
9
-
10
-
11
-
12
-
13
-
14
-
15
-
16
-
17
-
18
-
19
-
20
-
21
-
22
-
23
-
24
-
25
-
26
-
27
-
28
-
29
-
30
-
31
-
32
-
33
-
34
-
 35
35 -
 36
36 -
 37
37 -
 38
38 -
 39
39 -
 40
40 -
 41
41 -
 42
42 -
 43
43 -
 44
44 -
 45
45 -
 46
46 -
 47
47 -
 48
48 -
 49
49 -
 50
50 -
 51
51 -
 52
52 -
 53
53 -
 54
54 -
 55
55 -
56
-
57
-
58
-
59
-
60
-
61
-
62
-
63
-
64
-
65
-
66
-
67
-
68
-
69
-
70
-
71
-
72
-
73
-
74
-
75
-
76
-
77
-
78
-
79
-
80
-
81
-
82
-
83
-
84
-
85
-
86
 |
 |

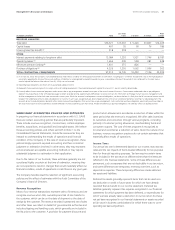
Management’sDiscussionandAnalysis TheProcter&GambleCompany 43
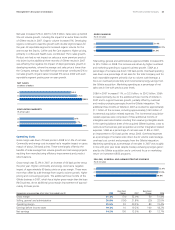
Netsalesincreased12%in2007to$76.5billion.Saleswereupbehind
9%unitvolumegrowth,includingtheimpactofanextrathreemonths
ofGilletteresultsin2007.Organicvolumeincreased5%.Developing
regionscontinuedtoleadthegrowthwithdouble-digitincreasesfor
theyear.Allreportablesegmentsincreasedorganicvolumeforthe
yearexcepttheSnacks,CoffeeandPetCaresegment.Higherpricing,
primarilyincoffeeandHealthCare,contributed1%tosalesgrowth.
Productmixhadnonetimpactonsalesasamorepremiumproduct
mixdrivenbytheadditionalthreemonthsofGilletteresultsin2007
wasoffsetbythenegativemiximpactofdisproportionategrowthin
developingmarkets,wheretheaverageunitsalespriceislowerthan
theCompanyaverage.Favorableforeignexchangecontributed2%to
netsalesgrowth.Organicsalesincreased5%versus2006witheach
reportablesegmentpostingyear-on-yeargrowth.
68.2
76.5
06
07
(inbillionsofdollars)
26%
27%
06
07
(%ofnetsales)
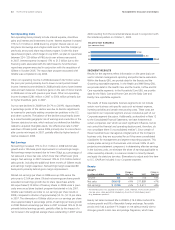
Grossmarginwasdown70basispointsin2008to51.3%ofnetsales.
Commodityandenergycostincreaseshadanegativeimpactongross
marginofabout200basispoints.Thesewerelargelyoffsetbythe
benetsofscaleleveragefromvolumegrowthandcostsavingsprojects
resultingfrommanufacturingefciencyimprovementsandproduct
reformulations.
Grossmarginwas52.0%in2007,anincreaseof60basispointsversus
theprioryear.Highercommodityandenergycostshadanegative
impactofapproximately60basispointsongrossmargin.Thesewere
morethanoffsetbyscaleleveragefromorganicvolumegrowth,higher
pricingandcostsavingsprojects.Theadditionalthreemonthsofthe
Gillettebusinessin2007,whichhasahighergrossmarginthanthebase
P&Gbusiness,droveadditionalgrossmarginimprovementofapproxi-
mately30basispoints.
51.4%
52.0%
06
07
(%ofnetsales)
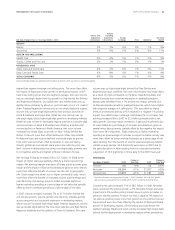
Totalselling,generalandadministrativeexpenses(SG&A)increased6%
to$25.7billionin2008.Theincreasewasdrivenbyhigheroverhead
andmarketingspendingtosupportbusinessgrowth.SG&Aasa
percentageofnetsaleswasdown100basispoints.Overheadspending
wasdownasapercentageofnetsalesforthetotalCompanyandfor
eachreportablesegmentprimarilyduetovolumescaleleverage,a
focusonoverheadproductivityandincrementalsynergysavingsfrom
theGilletteacquisition.Marketingspendingasapercentageofnet
saleswasinlinewithpreviousyearlevels.
SG&Ain2007increased11%,or$2.5billion,to$24.3billion.SG&A
increasedprimarilyduetotheadditionalthreemonthsofGillettein
2007andtosupportbusinessgrowth,partiallyoffsetbyoverhead
andmediapurchasingsynergiesfromtheGilletteintegration.The
additionalthreemonthsofGillettein2007accountedforapproximately
$1.1billionoftheincrease,includingapproximately$160millionof
incrementalacquisition-relatedexpenses.Theincrementalacquisition-
relatedexpenseswerecomprisedofthreeadditionalmonthsof
intangibleassetamortizationresultingfromrevaluingintangibleassets
intheopeningbalancesheetoftheacquiredGillettebusiness,coststo
restructurethebusinesspost-acquisitionandotherintegration-related
expenses.SG&Aasapercentageofnetsaleswas31.8%in2007,
animprovementof20basispointsversus2006.Overheadexpenses
asapercentageofnetsalesweredownduetovolumescaleleverage,
overheadcostcontrolandsynergiesfromtheGilletteintegration.
Marketingspendingasapercentageofnetsalesin2007wasroughly
inlinewithprioryearlevelsdespitemediapurchasingsynergiesgener-
atedbytheGilletteacquisitionandacontinuedfocusonmarketing
return-on-investment(ROI)programs.
32.0%
31.8%
06
07
(%ofnetsales)
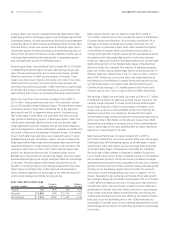
BasisPoint BasisPoint
Comparisonsasapercentageofnetsales;YearsendedJune30 Change 2007 Change 2006
Grossmargin (70) 52.0% 60 51.4%
Selling,generalandadministrative (100) 31.8% (20) 32.0%
Operatingmargin 30 20.2% 80 19.4%
Earningsbeforeincometaxes 10 19.2% 100 18.2%
Netearnings 100 13.5% 80 12.7%