Proctor and Gamble 2008 Annual Report Download - page 57
Download and view the complete annual report
Please find page 57 of the 2008 Proctor and Gamble annual report below. You can navigate through the pages in the report by either clicking on the pages listed below, or by using the keyword search tool below to find specific information within the annual report.-
 1
1 -
2
-
3
-
4
-
5
-
6
-
7
-
8
-
9
-
10
-
11
-
12
-
13
-
14
-
15
-
16
-
17
-
18
-
19
-
20
-
21
-
22
-
23
-
24
-
25
-
26
-
27
-
28
-
29
-
30
-
31
-
32
-
33
-
34
-
35
-
36
-
37
-
38
-
39
-
40
-
41
-
42
-
43
-
44
-
45
-
46
-
 47
47 -
 48
48 -
 49
49 -
 50
50 -
 51
51 -
 52
52 -
 53
53 -
 54
54 -
 55
55 -
 56
56 -
 57
57 -
 58
58 -
 59
59 -
 60
60 -
 61
61 -
 62
62 -
 63
63 -
 64
64 -
 65
65 -
 66
66 -
 67
67 -
68
-
69
-
70
-
71
-
72
-
73
-
74
-
75
-
76
-
77
-
78
-
79
-
80
-
81
-
82
-
83
-
84
-
85
-
86
 |
 |

Management’sDiscussionandAnalysis TheProcter&GambleCompany 55
Ourdiscussionofnancialresultsincludesseveral“non-GAAP”
nancialmeasures.Webelievethesemeasuresprovideourinvestors
withadditionalinformationaboutourunderlyingresultsandtrends,as
wellasinsighttosomeofthemetricsusedtoevaluatemanagement.
WhenusedinMD&A,wehaveprovidedthecomparableGAAP
measureinthediscussion.Thesemeasuresinclude:
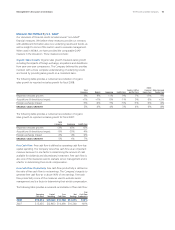
Organic Sales Growth. Organicsalesgrowthmeasuressalesgrowth
excludingtheimpactsofforeignexchange,acquisitionsanddivestitures
fromyear-over-yearcomparisons.TheCompanybelievesthisprovides
investorswithamorecompleteunderstandingofunderlyingresults
andtrendsbyprovidingsalesgrowthonaconsistentbasis.
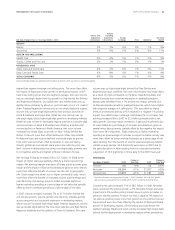
Thefollowingtableprovidesanumericalreconciliationoforganic
salesgrowthtoreportednetsalesgrowthforscal2008:
Fabric
Total Snacks,Coffee Careand BabyCareand
Company Beauty Grooming HealthCare andPetCare HomeCare FamilyCare
Reportednetsalesgrowth 9% 9% 11% 9% 7% 11% 9%
Acquisitions&divestituresimpact +1% +1% 0% -1% 0% 0% +3%
Foreignexchangeimpact -5% -6% -7% -5% -3% -5% -4%
5% 4% 4% 3% 4% 6% 8%
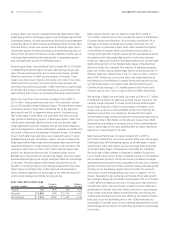
Thefollowingtableprovidesanumericalreconciliationoforganic
salesgrowthtoreportednetsalesgrowthforscal2007:
Total
Company Grooming HealthCare
Reportednetsalesgrowth 12% 45% 13%
Acquisitions&divestituresimpact -5% -35% -4%
Foreignexchangeimpact -2% -4% -2%
5% 6% 7%
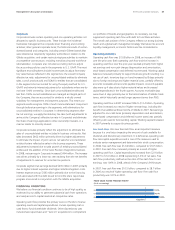
Free Cash Flow. Freecashowisdenedasoperatingcashowless
capitalspending.TheCompanyviewsfreecashowasanimportant
measurebecauseitisonefactorindeterminingtheamountofcash
availablefordividendsanddiscretionaryinvestment.Freecashowis
alsooneofthemeasuresusedtoevaluateseniormanagementandis
afactorindeterminingtheirat-riskcompensation.
Free Cash Flow Productivity. Freecashowproductivityisdenedas
theratiooffreecashowtonetearnings.TheCompany’stargetisto
generatefreecashowatorabove90%ofnetearnings.Freecash
owproductivityisoneofthemeasuresusedtoevaluatesenior
managementandisafactorindeterminingtheirat-riskcompensation.
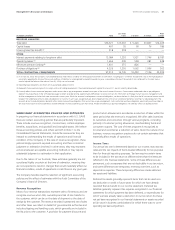
Thefollowingtableprovidesanumericalreconciliationoffreecashow:
Free
Operating Capital Free Net CashFlow
CashFlow Spending CashFlow Earnings Productivity
2007 $13,435 $(2,945) $10,490 $10,340 101%