Proctor and Gamble 2008 Annual Report Download - page 83
Download and view the complete annual report
Please find page 83 of the 2008 Proctor and Gamble annual report below. You can navigate through the pages in the report by either clicking on the pages listed below, or by using the keyword search tool below to find specific information within the annual report.-
 1
1 -
2
-
3
-
4
-
5
-
6
-
7
-
8
-
9
-
10
-
11
-
12
-
13
-
14
-
15
-
16
-
17
-
18
-
19
-
20
-
21
-
22
-
23
-
24
-
25
-
26
-
27
-
28
-
29
-
30
-
31
-
32
-
33
-
34
-
35
-
36
-
37
-
38
-
39
-
40
-
41
-
42
-
43
-
44
-
45
-
46
-
47
-
48
-
49
-
50
-
51
-
52
-
53
-
54
-
55
-
56
-
57
-
58
-
59
-
60
-
61
-
62
-
63
-
64
-
65
-
66
-
67
-
68
-
69
-
70
-
71
-
72
-
 73
73 -
 74
74 -
 75
75 -
 76
76 -
 77
77 -
 78
78 -
 79
79 -
 80
80 -
 81
81 -
 82
82 -
 83
83 -
 84
84 -
 85
85 -
 86
86
 |
 |
TheProcter&GambleCompany 81
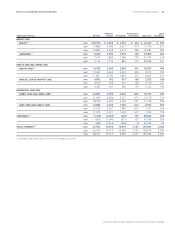
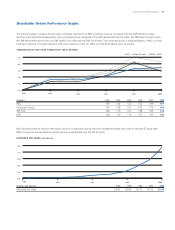
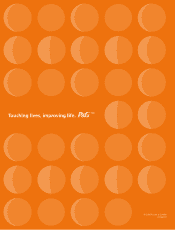
Thefollowinggraphcomparestheve-yearcumulativetotalreturnofP&G’scommonstockascomparedwiththeS&P500StockIndex,
theDowJonesIndustrialAverageIndex,andacompositegroupcomprisedoftheS&PHouseholdProductsIndex,theS&PPaperProductsIndex,
theS&PPersonalProductsIndex,theS&PHealthCareIndexandtheS&PFoodIndex.ThecompositegroupisweightedbasedonP&G’scurrent
scalyearrevenues.Thegraphassumes$100wasinvestedonJune30,2003andthatalldividendswerereinvested.
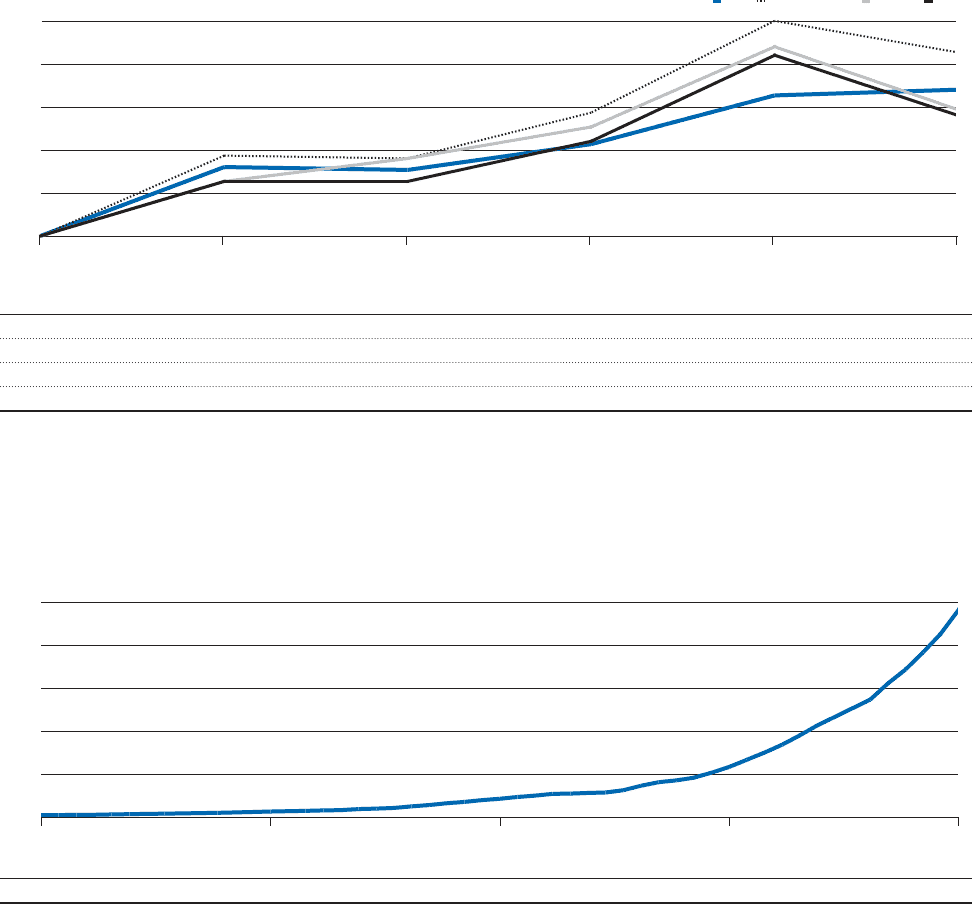
P&Ghaspaiddividendswithoutinterruptionsinceitsincorporationalongwiththeincreaseddividendseachyearforthepast52scalyears.
P&G’scompoundannualdividendgrowthratehasexceeded9%overthelast52years.
(split-adjusted)
(indollars) 2003 2004 2005 2006 2007
P&G 100 124 123 132 149
CompositeGroup 100 128 127 143 175
S&P500 100 119 127 138 166
DJIA 100 119 119 133 163
100
115
130
145
160
175
P&G S&P500 DJIA
CompositeGroup
200720062005
2003 2004
(indollars;split-adjusted) 1956 1969 1982 1995
DividendsperShare $0.01 $0.04 $0.13 $0.35
0.00
0.30
0.60
0.90
1.20
1.50
199519821969
1956