Proctor and Gamble 2008 Annual Report Download - page 77
Download and view the complete annual report
Please find page 77 of the 2008 Proctor and Gamble annual report below. You can navigate through the pages in the report by either clicking on the pages listed below, or by using the keyword search tool below to find specific information within the annual report.-
 1
1 -
2
-
3
-
4
-
5
-
6
-
7
-
8
-
9
-
10
-
11
-
12
-
13
-
14
-
15
-
16
-
17
-
18
-
19
-
20
-
21
-
22
-
23
-
24
-
25
-
26
-
27
-
28
-
29
-
30
-
31
-
32
-
33
-
34
-
35
-
36
-
37
-
38
-
39
-
40
-
41
-
42
-
43
-
44
-
45
-
46
-
47
-
48
-
49
-
50
-
51
-
52
-
53
-
54
-
55
-
56
-
57
-
58
-
59
-
60
-
61
-
62
-
63
-
64
-
65
-
66
-
 67
67 -
 68
68 -
 69
69 -
 70
70 -
 71
71 -
 72
72 -
 73
73 -
 74
74 -
 75
75 -
 76
76 -
 77
77 -
 78
78 -
 79
79 -
 80
80 -
 81
81 -
 82
82 -
 83
83 -
 84
84 -
 85
85 -
 86
86
 |
 |

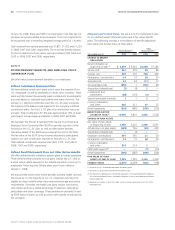
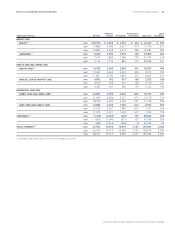
NotestoConsolidatedFinancialStatements TheProcter&GambleCompany 75
Amountsinmillionsofdollarsexceptpershareamountsorasotherwisespecied.
Before-Tax Depreciation& Capital
GlobalSegmentResults NetSales Earnings NetEarnings Amortization TotalAssets Expenditures
(1)
2007 17,889 3,440 2,611 419 11,140 431
2006 16,687 3,262 2,412 380 10,081 384
(1)
2007 7,437 1,895 1,383 729 27,767 314
2006 5,114 1,176 846 573 28,994 361
(1)
2007 13,381 3,365 2,233 439 9,512 374
2006 11,831 2,785 1,829 374 9,636 341
2007 4,537 759 477 164 2,176 141
2006 4,383 627 385 159 2,122 150
(1)
2007 21,469 4,650 3,127 573 12,179 710
2006 18,918 3,905 2,609 521 11,318 599
2007 12,726 2,291 1,440 671 7,731 769
2006 11,972 2,071 1,299 612 7,339 739
(1)
2007 (963) (1,690) (931) 135 67,509 206
2006 (683) (1,413) (696) 8 66,205 93
(1)
2007 76,476 14,710 10,340 3,130 138,014 2,945
2006 68,222 12,413 8,684 2,627 135,695 2,667
(1)2006dataincludesGilletteresultsfortheninemonthsendedJune30,2006.