Proctor and Gamble 2011 Annual Report Download - page 35
Download and view the complete annual report
Please find page 35 of the 2011 Proctor and Gamble annual report below. You can navigate through the pages in the report by either clicking on the pages listed below, or by using the keyword search tool below to find specific information within the annual report.-
 1
1 -
2
-
3
-
4
-
5
-
6
-
7
-
8
-
9
-
10
-
11
-
12
-
13
-
14
-
15
-
16
-
17
-
18
-
19
-
20
-
21
-
22
-
23
-
24
-
 25
25 -
 26
26 -
 27
27 -
 28
28 -
 29
29 -
 30
30 -
 31
31 -
 32
32 -
 33
33 -
 34
34 -
 35
35 -
 36
36 -
 37
37 -
 38
38 -
 39
39 -
 40
40 -
 41
41 -
 42
42 -
 43
43 -
 44
44 -
 45
45 -
46
-
47
-
48
-
49
-
50
-
51
-
52
-
53
-
54
-
55
-
56
-
57
-
58
-
59
-
60
-
61
-
62
-
63
-
64
-
65
-
66
-
67
-
68
-
69
-
70
-
71
-
72
-
73
-
74
-
75
-
76
-
77
-
78
-
79
-
80
-
81
-
82
 |
 |
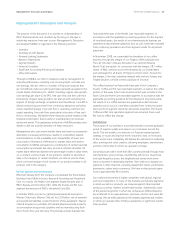
Management’s Discussion and AnalysisThe Procter & Gamble Company 33
The purpose of this discussion is to provide an understanding of
P&G’s financial results and condition by focusing on changes in
certain key measures from year to year. Management’s Discussion
and Analysis (MD&A) is organized in the following sections:
ō Overview
ō Summary of Results
ō Forward-Looking Statements
ō Results of Operations
ō Segment Results
ō Financial Condition
ō Significant Accounting Policies and Estimates
ō Other Information
Throughout MD&A, we refer to measures used by management to
evaluate performance, including unit volume growth, net sales and
net earnings. We also refer to a number of financial measures that
are not defined under accounting principles generally accepted in the
United States of America (U.S. GAAP), including organic sales growth,
core earnings per share (Core EPS), free cash flow and free cash flow
productivity. Organic sales growth is net sales growth excluding the
impacts of foreign exchange, acquisitions and divestitures. Core EPS is
diluted net earnings per share from continuing operations excluding
certain specified charges. Free cash flow is operating cash flow less
capital spending. Free cash flow productivity is the ratio of free cash
flow to net earnings. We believe these measures provide investors with
important information that is useful in understanding our business
results and trends. The explanation at the end of MD&A provides more
details on the use and the derivation of these measures.
Management also uses certain market share and market consumption
estimates to evaluate performance relative to competition despite
some limitations on the availability and comparability of share and
consumption information. References to market share and market
consumption in MD&A are based on a combination of vendor-reported
consumption and market size data, as well as internal estimates. All
market share references represent the percentage of sales in dollar terms
on a constant currency basis of our products, relative to all product
sales in the category. In certain situations, we discuss volume share,
which is the percentage of unit volume of our products relative to all
products sold in the category.
Recent Business Developments
Effective February , the Company consolidated the three Global
Business Units (GBUs) into two: Beauty & Grooming and Household
Care. As a result, the Health Care segment largely became part of
P&G’s Beauty and Grooming GBU, while the Snacks and Pet Care
segment became part of P&G’s Household Care GBU.
In October 2009, we sold our global pharmaceuticals business to
Warner Chilcott plc (Warner Chilcott) for $2.8billion, net of assumed
and transferred liabilities. Under the terms of the agreement, Warner
Chilcott acquired our portfolio of branded pharmaceuticals products,
our prescription drug product pipeline and our manufacturing facili-
ties in Puerto Rico and Germany. The pharmaceuticals business had
historically been part of the Health Care reportable segment. In
accordance with the applicable accounting guidance for the disposal
of long-lived assets, the results of our pharmaceuticals business are
presented as discontinued operations and, as such, have been excluded
from continuing operations and from segment results for all periods
presented.
In November 2008, we completed the divestiture of our coffee
business through the merger of our Folgers coffee subsidiary into
TheJ.M.Smucker Company (Smucker) in an all-stock Reverse
MorrisTrust transaction. In connection with the merger, 38.7million
shares of P&G common stock were tendered by our shareholders
and exchanged for all shares of Folgers common stock. Pursuant to
the merger, a Smucker subsidiary merged with and into Folgers and
Folgers became a wholly-owned subsidiary of Smucker.
The coffee business had historically been part of the Company’s
Snacks, Coffee and Pet Care reportable segment, as well as the coffee
portion of the away-from-home business which was included in the
Fabric Care and Home Care reportable segment. In accordance with the
applicable accounting guidance for the disposal of long-lived assets,
the results of our coffee business are presented as discontinued
operations and, as such, have been excluded from continuing opera-
tions and from segment results for all periods presented. The Snacks,
Coffee and Pet Care reportable segment was renamed Snacks and
PetCare to reflect this change.
OVERVIEW
The purpose of our business is to provide branded consumer packaged
goods of superior quality and value to our consumers around the
world. This will enable us to execute our Purpose-inspired growth
strategy: to touch and improve more consumers’ lives, in more parts
of the world, more completely. We believe this will result in leadership
sales, earnings and value creation, allowing employees, shareholders
and the communities in which we operate to prosper.
Our products are sold in more than 180 countries primarily through mass
merchandisers, grocery stores, membership club stores, drug stores
and high-frequency stores, the neighborhood stores which serve
many consumers in developing markets. We continue to expand our
presence in other channels, including department stores, perfumeries,
pharmacies, salons and e-commerce. We have on-the-ground opera-
tions in approximately 80 countries.
Our market environment is highly competitive with global, regional
and local competitors. In many of the markets and industry segments
in which we sell our products, we compete against other branded
products as well as retailers’ private-label brands. Additionally, many
of the product segments in which we compete are differentiated by
price (referred to as super-premium, premium, mid-tier and value-tier
products). We are well positioned in the industry segments and markets
in which we operate-often holding a leadership or significant market
share position.
Management’s Discussion and Analysis