Proctor and Gamble 2011 Annual Report Download - page 79
Download and view the complete annual report
Please find page 79 of the 2011 Proctor and Gamble annual report below. You can navigate through the pages in the report by either clicking on the pages listed below, or by using the keyword search tool below to find specific information within the annual report.-
 1
1 -
2
-
3
-
4
-
5
-
6
-
7
-
8
-
9
-
10
-
11
-
12
-
13
-
14
-
15
-
16
-
17
-
18
-
19
-
20
-
21
-
22
-
23
-
24
-
25
-
26
-
27
-
28
-
29
-
30
-
31
-
32
-
33
-
34
-
35
-
36
-
37
-
38
-
39
-
40
-
41
-
42
-
43
-
44
-
45
-
46
-
47
-
48
-
49
-
50
-
51
-
52
-
53
-
54
-
55
-
56
-
57
-
58
-
59
-
60
-
61
-
62
-
63
-
64
-
65
-
66
-
67
-
68
-
 69
69 -
 70
70 -
 71
71 -
 72
72 -
 73
73 -
 74
74 -
 75
75 -
 76
76 -
 77
77 -
 78
78 -
 79
79 -
 80
80 -
 81
81 -
 82
82
 |
 |

The Procter & Gamble Company 77
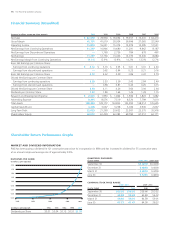
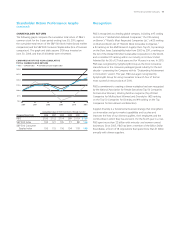
Shareholder Return Performance Graphs
(continued)
Recognition
SHAREHOLDER RETURN
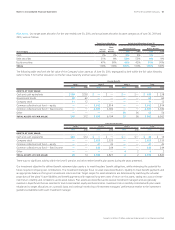
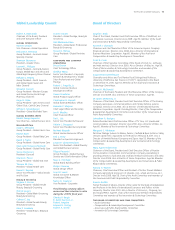
The following graph compares the cumulative total return of P&G’s
common stock for the -year period ending June 30,2011, against
the cumulative total return of the S&P 500 Stock Index (broad market
comparison) and the S&P 500 Consumer Staples Index (line of business
comparison). The graph and table assume $100 was invested on
June30,2006, and that all dividends were reinvested.
Cumulative Value of $100 Investment, through June 30
Company Name/Index 2006 2007 2008 2009 2010
P&G $100 $112 $114 $99 $119 $130
S&P 500 Index 100 121 105 77 88 116
S&P 500 Consumer
Staples Index 100 115 116 104 118 149
75.0
87.5
100.0
112.5
125.0
137.5
150.0
2011
2010200920082006 2007
S&P 500 Consumer Staples IndexP&G
COMPARISON OF FIVE-YEAR CUMULATIVE
TOTAL SHAREHOLDER RETURN
S&P 500 Index
P&G is recognized as a leading global company, including a #5ranking
on Fortune’s “Global Most Admired Companies,” the #10 ranking
onBarron’s “World’s Most Respected Companies List,” a #25 ranking
on Business Week’slist of “World’s Most Innovative Companies,”
a#3ranking on the AMR Research Supply Chain Top , top rankings
on the Dow Jones Sustainability Index from 2000 to 2011, a ranking on
the list of the Global 100 Most Sustainable Corporations in the World,
and a consistent #1ranking within our industry on Fortune’s Most
Admired list for 26 of 27 total years and for 14 years in a row. In 2010,
P&G was recognized by SymphonyIRI Group as the most innovative
manufacturer in the consumer packaged goods industry for the last
decade—presenting the Company with its “Outstanding Achievement
in Innovation” award. This year, P&G was again recognized by
SymphonyIRI Group for using innovation to launch four of the ten
most successful new products of 2010.
P&G’s commitment to creating a diverse workplace has been recognized
by the National Association for Female Executives (Top 50 Companies
for Executive Women), Working Mother magazine (Top20 Best
Companies for Multicultural Women) and DiversityInc (#25 ranking
on the Top 50 Companies for Diversity and #9ranking on the Top
Companies for Recruitment and Retention).
Supplier diversity is a fundamental business strategy that strengthens
our innovation and go-to-market capabilities and touches and
improves the lives of our diverse suppliers, their employees and the
communities in which they live and work. For the fourth year in a row,
P&G spent more than $2billion with minority- and women-owned
businesses. Since 2005, P&G has been a member of the Billion Dollar
Roundtable, a forum of 18 corporations that spend more than $1billion
annually with diverse suppliers.