Proctor and Gamble 2011 Annual Report Download - page 40
Download and view the complete annual report
Please find page 40 of the 2011 Proctor and Gamble annual report below. You can navigate through the pages in the report by either clicking on the pages listed below, or by using the keyword search tool below to find specific information within the annual report.-
 1
1 -
2
-
3
-
4
-
5
-
6
-
7
-
8
-
9
-
10
-
11
-
12
-
13
-
14
-
15
-
16
-
17
-
18
-
19
-
20
-
21
-
22
-
23
-
24
-
25
-
26
-
27
-
28
-
29
-
 30
30 -
 31
31 -
 32
32 -
 33
33 -
 34
34 -
 35
35 -
 36
36 -
 37
37 -
 38
38 -
 39
39 -
 40
40 -
 41
41 -
 42
42 -
 43
43 -
 44
44 -
 45
45 -
 46
46 -
 47
47 -
 48
48 -
 49
49 -
 50
50 -
51
-
52
-
53
-
54
-
55
-
56
-
57
-
58
-
59
-
60
-
61
-
62
-
63
-
64
-
65
-
66
-
67
-
68
-
69
-
70
-
71
-
72
-
73
-
74
-
75
-
76
-
77
-
78
-
79
-
80
-
81
-
82
 |
 |

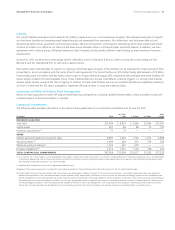
38 The Procter & Gamble CompanyManagement’s Discussion and Analysis
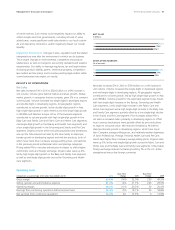
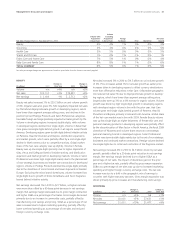
Gross margin contracted basis points in to .% of net sales.
The reduction in gross margin was driven mainly by a-basis point
increase in commodity and energy costs, along with negative product
mix from disproportionate growth in developing regions and mid-tier
products. These impacts were partially offset by manufacturing cost
savings and the favorable impact of volume scale leverage.
Gross margin expanded basis points in to .% of net
sales. Manufacturing and logistics cost savings projects and lower
commodity and energy costs positively impacted gross margin by
about basis points. Volume scale leverage and price increases also
contributed to gross margin expansion. These impacts were partially
offset by unfavorable foreign exchange and product mix impacts.
.%
.%
.%
11
09
10
GROSS MARGIN
(% of net sales)
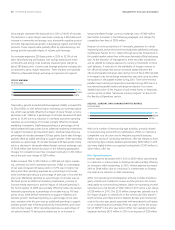
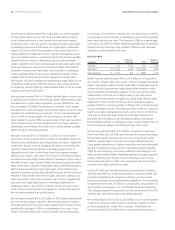
Total selling, general and administrative expenses (SG&A) increased %
to $.billion in behind higher marketing and overhead spend-
ing, which was partially offset by the impact of lower foreign currency
exchange costs. SG&A as a percentage of net sales decreased 30 basis
points to 31.4% due to a reduction in overhead and other operating
expenses as a percentage of net sales, partially offset by increased
marketing investments. Marketing spending as a percentage of net
sales increased 60 basis points due to additional marketing investments
to support innovation and expansion plans. Overhead spending as a
percentage of net sales decreased 50 basis points due to sales leverage,
partially offset by added spending to support growth. Other operating
expenses as a percentage of net sales decreased 40basis points mainly
due to a decrease in Venezuela-related foreign currency exchange costs
of $548 million (see further discussion in the following paragraphs).
Charges for competition law fines increased nominally to $303 million
versus the prior year charge of $283 million.
SG&A increased 10% to $25.0billion in 2010 behind higher market-
ing, overhead and other operating expenses. SG&A as a percentage
of net sales increased 220 basis points to 31.7% due to higher mar-
keting and other operating expenses as a percentage of net sales,
while overhead spending as a percentage of sales was in line with the
prior year. Marketing spending as a percentage of net sales was up
150 basis points as additional marketing investments, primarily to
increase media impressions, and the impact of reduced spending in
the fourth quarter of 2009 were partially offset by media rate savings.
Advertising spending as a percentage of net sales was up 110 basis
points versus2009 behind investments to support initiatives and
business growth. Overhead spending as a percentage of net sales
was consistent with the prior year as additional spending to support
business growth wasoffset by productivity improvements and lower
restructuring charges. Other operating expenses as a percentage of
net sales increased 70basis points mainly due to an increase in
Venezuela-related foreign currency exchange costs of $492 million
(see further discussion in the following paragraph) and charges for
competition law fines of $283million.
Because of currency restrictions in Venezuela, payments for certain
imported goods and services have historically been satisfied by exchang-
ing Bolivares Fuertes for U.S. dollars through securities transactions in
the parallel market rather than at the more favorable official exchange
rate. At the discretion of management, these securities transactions
can be utilized to manage exposure to currency movements on local
cash balances. A reduction in the availability of foreign currency at
the official exchange rate and an increased spread between the
official and parallel exchange rates during most of fiscal 2010 resulted
in increased costs for exchange transactions executed using securities
transactions in the parallel market during 2010. There were minimal
parallel market exchange transactions executed during 2011 due to a
very restrictive parallel market exchange mechanism. For a more
detailed discussion of the impacts of and recent events in Venezuela,
see the section entitled “Venezuela Currency Impacts” at the end of
this Results of Operations section.
29.5%
31.4%
31.7%
11
09
10
SELLING, GENERAL AND ADMINISTRATIVE EXPENSE
(% of net sales)
We fund a number of restructuring-type activities, primarily related
tomanufacturing and workforce optimization efforts, to maintain a
competitive cost structure and to integrate acquired businesses.
Within our results of continuing operations, after-tax charges to fund
restructuring-type activities declined approximately $200 million in 2011,
and were slightly below our ongoing funding level of $300million to
$400million, after tax.
Non-Operating Items
Interest expense decreased 12% in 2011 to $831 million due primarily
to a reduction in interest rates on floating rate debt partially offset by
an increase in debt outstanding. In 2010, interest expense decreased
30% to $946 million due to a reduction in interest rates on floating
rate debt and a reduction in debt outstanding.
Other non-operating income/(expense) primarily includes divestiture
gains, interest and investment income and the provision for income
attributable to noncontrolling interests. Other non-operating income/
(expense) was a net benefit of $202 million in 2011 versus a net charge
of $28 million in 2010. This $230 million change was primarily due to
the impact of gains on divestitures in the current year (Zest brand in
North America and Infasil brand in Western Europe) and incremental
costs in the prior year period associated with exercising the call option
on an outstanding bond, partially offset by a gain due to the acquisi-
tion of MDVIP in the prior year period. Other non-operating income/
(expense) declined $425 million in 2010 to an expense of $28million