Proctor and Gamble 2011 Annual Report Download - page 58
Download and view the complete annual report
Please find page 58 of the 2011 Proctor and Gamble annual report below. You can navigate through the pages in the report by either clicking on the pages listed below, or by using the keyword search tool below to find specific information within the annual report.-
 1
1 -
2
-
3
-
4
-
5
-
6
-
7
-
8
-
9
-
10
-
11
-
12
-
13
-
14
-
15
-
16
-
17
-
18
-
19
-
20
-
21
-
22
-
23
-
24
-
25
-
26
-
27
-
28
-
29
-
30
-
31
-
32
-
33
-
34
-
35
-
36
-
37
-
38
-
39
-
40
-
41
-
42
-
43
-
44
-
45
-
46
-
47
-
 48
48 -
 49
49 -
 50
50 -
 51
51 -
 52
52 -
 53
53 -
 54
54 -
 55
55 -
 56
56 -
 57
57 -
 58
58 -
 59
59 -
 60
60 -
 61
61 -
 62
62 -
 63
63 -
 64
64 -
 65
65 -
 66
66 -
 67
67 -
 68
68 -
69
-
70
-
71
-
72
-
73
-
74
-
75
-
76
-
77
-
78
-
79
-
80
-
81
-
82
 |
 |
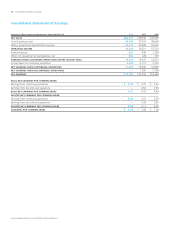
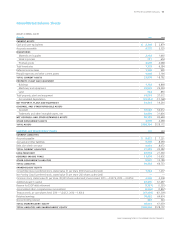
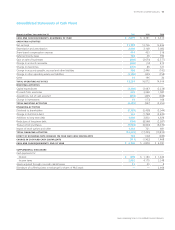
Amounts in millions of dollars except per share amounts or as otherwise specified.
56 The Procter & Gamble Company
NOTE 1
SUMMARYOF SIGNIFICANT ACCOUNTING POLICIES
Nature of Operations
The Procter& Gamble Company’s (the “Company,” “we” or “us”)
business is focused on providing branded consumer packaged goods
of superior quality and value. Our products are sold in more than
180countries primarily through retail operations including mass
merchandisers, grocery stores, membership club stores, drug stores,
department stores, salons and high-frequency stores. We have on-the-
ground operations in approximately 80 countries.
Basis of Presentation
The Consolidated Financial Statements include the Company and its
controlled subsidiaries. Intercompany transactions are eliminated.
Use of Estimates
Preparation of financial statements in conformity with accounting
principles generally accepted in the United States of America (U.S. GAAP)
requires management to make estimates and assumptions that affect
the amounts reported in the Consolidated Financial Statements and
accompanying disclosures. These estimates are based on manage-
ment’s best knowledge of current events and actions the Company may
undertake in the future. Estimates are used in accounting for, among
other items, consumer and trade promotion accruals, pensions, post-
employment benefits, stock options, valuation of acquired intangible
assets, useful lives for depreciation and amortization of long-lived
assets, future cash flows associated with impairment testing for
goodwill, indefinite-lived intangible assets and other long-lived assets,
deferred tax assets, uncertain income tax positions and contingencies.
Actual results may ultimately differ from estimates, although manage-
ment does not generally believe such differences would materially
affect the financial statements in any individual year. However, in regard to
ongoing impairment testing of goodwill and indefinite-lived intangible
assets, significant deterioration in future cash flow projections or
other assumptions used in valuation models, versus those anticipated
at the time of the valuations, could result in impairment charges that
may materially affect the financial statements in a given year.
Revenue Recognition
Sales are recognized when revenue is realized or realizable and has
been earned. Revenue transactions represent sales of inventory. The
revenue recorded is presented net of sales and other taxes we collect
on behalf of governmental authorities. The revenue includes shipping
and handling costs, which generally are included in the list price to
the customer. Our policy is to recognize revenue when title to the
product, ownership and risk of loss transfer to the customer, which can
be on the date of shipment or the date of receipt by the customer.
Aprovision for payment discounts and product return allowances is
recorded as a reduction of sales in the same period thatthe revenue
is recognized.
Trade promotions, consisting primarily of customer pricing allowances,
merchandising funds and consumer coupons, are offered through
various programs to customers and consumers. Sales are recorded net
of trade promotion spending, which is recognized as incurred, generally
at the time of the sale. Most of these arrangements have terms of
approximately one year. Accruals for expected payouts under these
programs are included as accrued marketing and promotion in the
accrued and other liabilities line item in the Consolidated Balance Sheets.
Cost of Products Sold
Cost of products sold is primarily comprised of direct materials and
supplies consumed in the manufacture of product, as well as manu-
facturing labor, depreciation expense and direct overhead expense
necessary to acquire and convert the purchased materials and supplies
into finished product. Cost of products sold also includes the cost to
distribute products to customers, inbound freight costs, internal transfer
costs, warehousing costs and other shipping and handling activity.
Selling, General and Administrative Expense
Selling, general and administrative expense (SG&A) is primarily comprised
of marketing expenses, selling expenses, research and development
costs, administrative and other indirect overhead costs, depreciation
and amortization expense on non-manufacturing assets and other
miscellaneous operating items. Research and development costs are
charged to expense as incurred and were $2,001 in 2011, $1,950 in
2010 and $1,864 in 2009. Advertising costs, charged to expense as
incurred, include worldwide television, print, radio, internet and
in-store advertising expenses and were $9,315 in 2011, $8,576 in 2010
and $7,519 in 2009. Non-advertising related components of the
Company’s total marketing spending include costs associated with
consumer promotions, product sampling and sales aids, all of which
are included in SG&A, as well as coupons and customer trade funds,
which are recorded as reductions to net sales.
Other Non-Operating Income/(Expense), Net
Other non-operating income/(expense), net, primarily includes net
divestiture gains, interest and investment income and the provision
for income attributable to noncontrolling interests.
Currency Translation
Financial statements of operating subsidiaries outside the United States
of America (U.S.) generally are measured using the local currency as
the functional currency. Adjustments to translate those statements
into U.S. dollars are recorded in other comprehensive income (OCI).
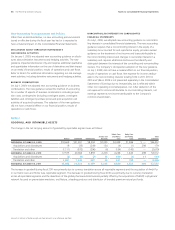
Currency translation adjustments in accumulated OCI were a gain of
$5,632 at June 30,2011 and a loss of $861 at June30,2010. For
subsidiaries operating in highly inflationary economies, the U.S. dollar
is the functional currency. Remeasurement adjustments for financial
statements in highly inflationary economies and other transactional
exchange gains and losses are reflected in earnings.
Notes to Consolidated Financial Statements