Proctor and Gamble 2011 Annual Report Download - page 69
Download and view the complete annual report
Please find page 69 of the 2011 Proctor and Gamble annual report below. You can navigate through the pages in the report by either clicking on the pages listed below, or by using the keyword search tool below to find specific information within the annual report.-
 1
1 -
2
-
3
-
4
-
5
-
6
-
7
-
8
-
9
-
10
-
11
-
12
-
13
-
14
-
15
-
16
-
17
-
18
-
19
-
20
-
21
-
22
-
23
-
24
-
25
-
26
-
27
-
28
-
29
-
30
-
31
-
32
-
33
-
34
-
35
-
36
-
37
-
38
-
39
-
40
-
41
-
42
-
43
-
44
-
45
-
46
-
47
-
48
-
49
-
50
-
51
-
52
-
53
-
54
-
55
-
56
-
57
-
58
-
 59
59 -
 60
60 -
 61
61 -
 62
62 -
 63
63 -
 64
64 -
 65
65 -
 66
66 -
 67
67 -
 68
68 -
 69
69 -
 70
70 -
 71
71 -
 72
72 -
 73
73 -
 74
74 -
 75
75 -
 76
76 -
 77
77 -
 78
78 -
 79
79 -
80
-
81
-
82
 |
 |

Notes to Consolidated Financial StatementsThe Procter & Gamble Company 67
Amounts in millions of dollars except per share amounts or as otherwise specified.
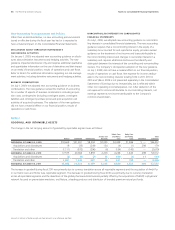
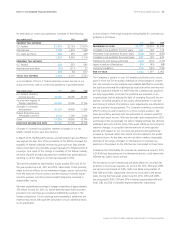
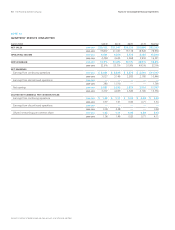
Plan Assets. Our target asset allocation for the year ended June30,2011, and actual asset allocation by asset category as of June30,2011 and
2010, were as follows:
TargetAssetAllocation ActualAssetAllocationatJune30
Pension
Benefits
Other
Retiree
Benefits
Pension Benefits
Other
Retiree Benefits
Asset Category 2010 2010
Cash 2% 2% 2% 4% 1% —
Debt securities 51% 8% 52% 53% 8% 9%
Equity securities 47% 90% 46% 43% 91% 91%
TOTAL100% 100% 100% 100% 100% 100%
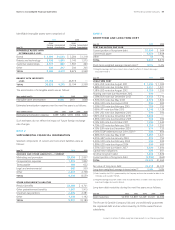
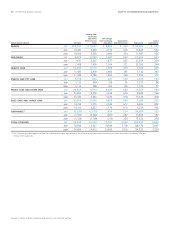
The following table sets forth the fair value of the Company’s plan assets as of June30,2011, segregated by level within the fair value hierarchy
(refer to Note 5for further discussion on the fair value hierarchy and fair value principles):
Pension Benefits
Level 1Level 2Level 3Total
2010 2010 2010 2010
ASSETS AT FAIR VALUE:
Cash and cash equivalents $189 $238 $— $— $— $— $189 $238
Government bonds 68 62 ————68 62
Company stock 11 12 ————11 12
Common collective trust fund—equity ——3,612 2,814 ——3,612 2,814
Common collective trust fund— fixed income ——4,027 3,380 ——4,027 3,380
Other ————55 56 55 56
TOTAL ASSETS AT FAIR VALUE 268 312 7,639 6,194 55 56 7,962 6,562
Other Retiree Benefits
Level 1Level 2Level 3Total
2010 2010 2010 2010
ASSETS AT FAIR VALUE:
Cash and cash equivalents $43 $14 $— $— $— $— $43 $14
Company stock ——2,655 2,535 ——2,655 2,535
Common collective trust fund—equity ——41 43 ——41 43
Common collective trust fund— fixed income ——232 249 ——232 249
Other ————4242
TOTAL ASSETS AT FAIR VALUE 43 14 2,928 2,827 422,975 2,843
There was no significant activity within the Level 3pension and other retiree benefits plan assets during the years presented.
Our investment objective for defined benefit retirement plan assets is to meet the plans’ benefit obligations, while minimizing the potential for
future required Company plan contributions. The investment strategies focus on asset class diversification, liquidity to meet benefit payments and
an appropriate balance of long-term investment return and risk. Target ranges for asset allocations are determined by matching the actuarial
projections of the plans’ future liabilities and benefit payments with expected long-term rates of return on the assets, taking into account invest-
ment return volatility and correlations across asset classes. Plan assets are diversified across several investment managers and are generally
invested in liquid funds that are selected to track broad market equity and bond indices. Investment risk is carefully controlled with plan assets
rebalanced to target allocations on a periodic basis and continual monitoring of investment managers’ performance relative to the investment
guidelines established with each investment manager.